Immigrants from Croatia vs Immigrants from Micronesia Unemployment Among Seniors over 75 years
COMPARE
Immigrants from Croatia
Immigrants from Micronesia
Unemployment Among Seniors over 75 years
Unemployment Among Seniors over 75 years Comparison
Immigrants from Croatia
Immigrants from Micronesia
8.3%
UNEMPLOYMENT AMONG SENIORS OVER 75 YEARS
97.2/ 100
METRIC RATING
121st/ 347
METRIC RANK
8.8%
UNEMPLOYMENT AMONG SENIORS OVER 75 YEARS
37.2/ 100
METRIC RATING
184th/ 347
METRIC RANK
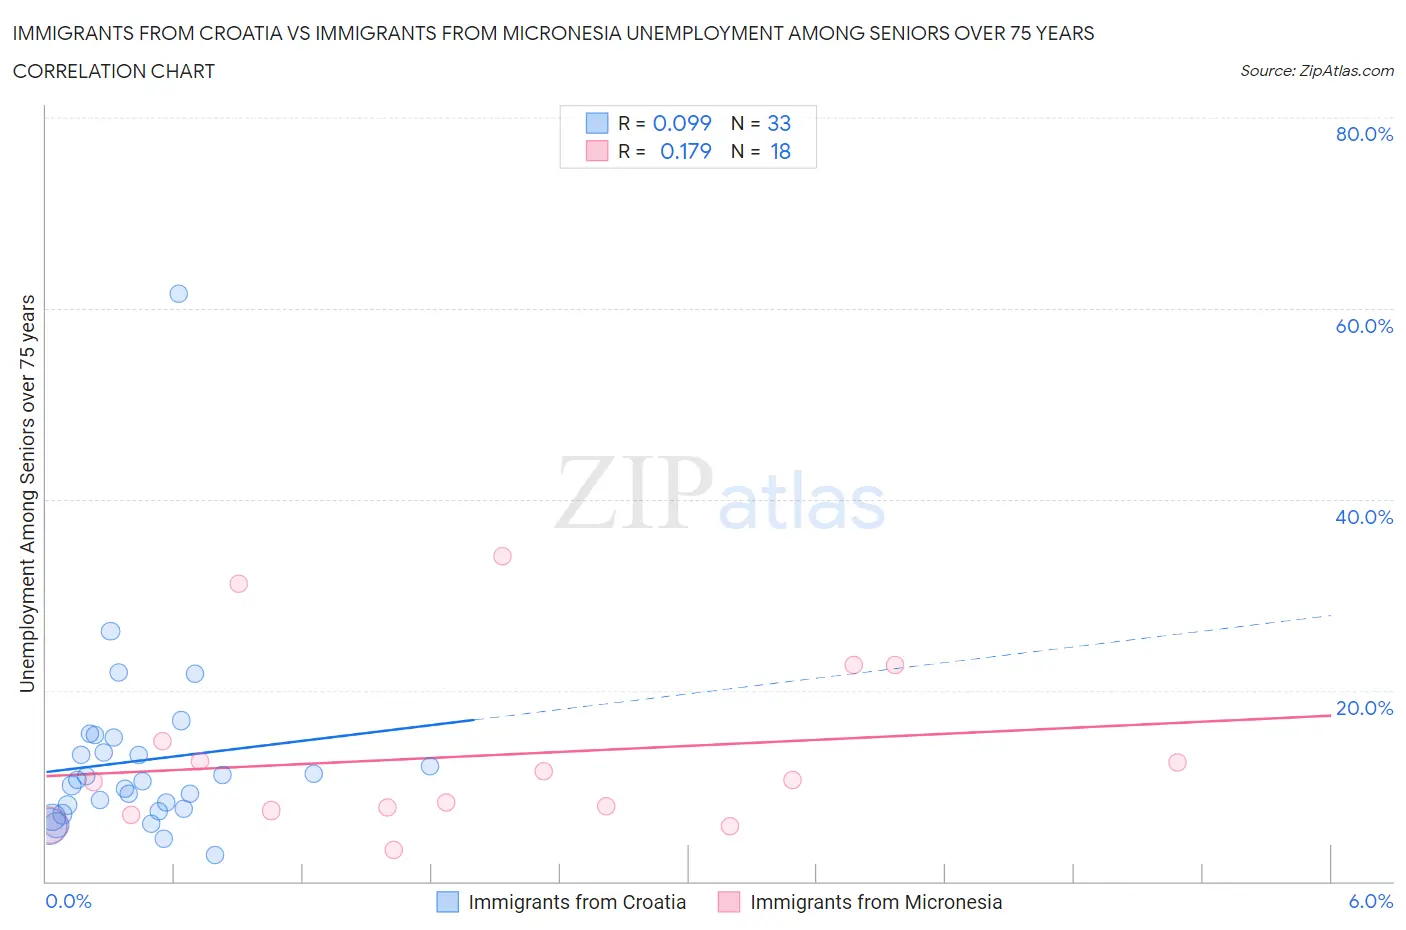
Immigrants from Croatia vs Immigrants from Micronesia Unemployment Among Seniors over 75 years Correlation Chart
The statistical analysis conducted on geographies consisting of 94,513,732 people shows a slight positive correlation between the proportion of Immigrants from Croatia and unemployment rate among seniors over the age of 75 in the United States with a correlation coefficient (R) of 0.099 and weighted average of 8.3%. Similarly, the statistical analysis conducted on geographies consisting of 48,327,887 people shows a poor positive correlation between the proportion of Immigrants from Micronesia and unemployment rate among seniors over the age of 75 in the United States with a correlation coefficient (R) of 0.179 and weighted average of 8.8%, a difference of 5.7%.
Unemployment Among Seniors over 75 years Correlation Summary
| Measurement | Immigrants from Croatia | Immigrants from Micronesia |
| Minimum | 2.8% | 3.3% |
| Maximum | 61.5% | 34.1% |
| Range | 58.7% | 30.8% |
| Mean | 12.6% | 13.1% |
| Median | 10.5% | 10.5% |
| Interquartile 25% (IQ1) | 7.4% | 7.4% |
| Interquartile 75% (IQ3) | 14.2% | 14.6% |
| Interquartile Range (IQR) | 6.8% | 7.2% |
| Standard Deviation (Sample) | 10.2% | 8.8% |
| Standard Deviation (Population) | 10.0% | 8.6% |
Similar Demographics by Unemployment Among Seniors over 75 years
Demographics Similar to Immigrants from Croatia by Unemployment Among Seniors over 75 years
In terms of unemployment among seniors over 75 years, the demographic groups most similar to Immigrants from Croatia are Immigrants from Russia (8.3%, a difference of 0.070%), Immigrants from Asia (8.3%, a difference of 0.13%), Japanese (8.3%, a difference of 0.15%), Immigrants from Nepal (8.3%, a difference of 0.15%), and Thai (8.3%, a difference of 0.19%).
| Demographics | Rating | Rank | Unemployment Among Seniors over 75 years |
| Trinidadians and Tobagonians | 98.4 /100 | #114 | Exceptional 8.3% |
| Sudanese | 98.2 /100 | #115 | Exceptional 8.3% |
| Immigrants | West Indies | 98.1 /100 | #116 | Exceptional 8.3% |
| Immigrants | Greece | 97.9 /100 | #117 | Exceptional 8.3% |
| Immigrants | Middle Africa | 97.9 /100 | #118 | Exceptional 8.3% |
| Japanese | 97.5 /100 | #119 | Exceptional 8.3% |
| Immigrants | Asia | 97.4 /100 | #120 | Exceptional 8.3% |
| Immigrants | Croatia | 97.2 /100 | #121 | Exceptional 8.3% |
| Immigrants | Russia | 97.1 /100 | #122 | Exceptional 8.3% |
| Immigrants | Nepal | 96.9 /100 | #123 | Exceptional 8.3% |
| Thais | 96.8 /100 | #124 | Exceptional 8.3% |
| Immigrants | Moldova | 96.7 /100 | #125 | Exceptional 8.3% |
| Belizeans | 96.3 /100 | #126 | Exceptional 8.4% |
| Hondurans | 96.2 /100 | #127 | Exceptional 8.4% |
| Native Hawaiians | 96.1 /100 | #128 | Exceptional 8.4% |
Demographics Similar to Immigrants from Micronesia by Unemployment Among Seniors over 75 years
In terms of unemployment among seniors over 75 years, the demographic groups most similar to Immigrants from Micronesia are Choctaw (8.8%, a difference of 0.0%), Immigrants from Afghanistan (8.8%, a difference of 0.060%), Immigrants from Ethiopia (8.8%, a difference of 0.060%), Immigrants from Europe (8.8%, a difference of 0.11%), and Guatemalan (8.8%, a difference of 0.13%).
| Demographics | Rating | Rank | Unemployment Among Seniors over 75 years |
| Central Americans | 43.3 /100 | #177 | Average 8.8% |
| West Indians | 41.9 /100 | #178 | Average 8.8% |
| Immigrants | Italy | 41.7 /100 | #179 | Average 8.8% |
| Immigrants | Somalia | 41.7 /100 | #180 | Average 8.8% |
| Immigrants | Thailand | 40.2 /100 | #181 | Average 8.8% |
| Guatemalans | 39.5 /100 | #182 | Fair 8.8% |
| Immigrants | Afghanistan | 38.2 /100 | #183 | Fair 8.8% |
| Immigrants | Micronesia | 37.2 /100 | #184 | Fair 8.8% |
| Choctaw | 37.1 /100 | #185 | Fair 8.8% |
| Immigrants | Ethiopia | 36.2 /100 | #186 | Fair 8.8% |
| Immigrants | Europe | 35.2 /100 | #187 | Fair 8.8% |
| Immigrants | Eastern Europe | 34.7 /100 | #188 | Fair 8.8% |
| Immigrants | Haiti | 34.7 /100 | #189 | Fair 8.8% |
| Mexican American Indians | 34.7 /100 | #190 | Fair 8.8% |
| Estonians | 33.3 /100 | #191 | Fair 8.8% |