Aleut vs Immigrants from Micronesia Unemployment Among Seniors over 75 years

COMPARE

Aleut
Race
Ancestry
AfghanAfricanAlaska NativeAlaskan AthabascanAlbanianAleutAlsatianAmericanApacheArabArapahoArgentineanArmenianAssyrian/Chaldean/SyriacAustralianAustrianBahamianBangladeshiBarbadianBasqueBelgianBelizeanBermudanBhutaneseBlackfeetBolivianBrazilianBritishBritish West IndianBulgarianBurmeseCajunCambodianCanadianCape VerdeanCarpatho RusynCelticCentral AmericanCentral American IndianCherokeeCheyenneChickasawChileanChineseChippewaChoctawColombianColvilleComancheCosta RicanCreeCreekCroatianCrowCubanCypriotCzechCzechoslovakianDanishDelawareDominicanDutchDutch West IndianEastern EuropeanEcuadorianEgyptianEnglishEstonianEthiopianEuropeanFijianFilipinoFinnishFrenchFrench American IndianFrench CanadianGermanGerman RussianGhanaianGreekGuamanian/ChamorroGuatemalanGuyaneseHaitianHmongHonduranHopiHoumaHungarianIcelanderIndian (Asian)IndonesianInupiatIranianIraqiIrishIroquoisIsraeliItalianJamaicanJapaneseJordanianKenyanKiowaKoreanLaotianLatvianLebaneseLiberianLithuanianLumbeeLuxembourgerMacedonianMalaysianMalteseMarshalleseMexicanMexican American IndianMongolianMoroccanNative HawaiianNavajoNepaleseNew ZealanderNicaraguanNigerianNorthern EuropeanNorwegianOkinawanOsageOttawaPaiutePakistaniPalestinianPanamanianParaguayanPennsylvania GermanPeruvianPimaPolishPortuguesePotawatomiPuebloPuerto RicanPuget Sound SalishRomanianRussianSalvadoranSamoanScandinavianScotch-IrishScottishSeminoleSenegaleseSerbianShoshoneSierra LeoneanSiouxSlavicSlovakSloveneSomaliSouth AfricanSouth AmericanSouth American IndianSoviet UnionSpaniardSpanishSpanish AmericanSpanish American IndianSri LankanSubsaharan AfricanSudaneseSwedishSwissSyrianTaiwaneseThaiTlingit-HaidaTohono O'OdhamTonganTrinidadian and TobagonianTsimshianTurkishU.S. Virgin IslanderUgandanUkrainianUruguayanUteVenezuelanVietnameseWelshWest IndianYakamaYaquiYugoslavianYumanYup'ikZimbabwean
Immigration
NonimmigrantsImmigrantsAfghanistanAfricaAlbaniaArgentinaArmeniaAsiaAustraliaAustriaBahamasBangladeshBarbadosBelarusBelgiumBelizeBoliviaBosnia and HerzegovinaBrazilBulgariaBurma/MyanmarCabo VerdeCambodiaCameroonCanadaCaribbeanCentral AmericaChileChinaColombiaCongoCosta RicaCroatiaCubaCzechoslovakiaDenmarkDominicaDominican RepublicEastern AfricaEastern AsiaEastern EuropeEcuadorEgyptEl SalvadorEnglandEritreaEthiopiaEuropeFijiFranceGermanyGhanaGreeceGrenadaGuatemalaGuyanaHaitiHondurasHong KongHungaryIndiaIndonesiaIranIraqIrelandIsraelItalyJamaicaJapanJordanKazakhstanKenyaKoreaKuwaitLaosLatin AmericaLatviaLebanonLiberiaLithuaniaMalaysiaMexicoMiddle AfricaMoldovaMoroccoNepalNetherlandsNicaraguaNigeriaNorth AmericaNorth MacedoniaNorthern AfricaNorthern EuropeNorwayOceaniaPakistanPanamaPeruPhilippinesPolandPortugalRomaniaRussiaSaudi ArabiaScotlandSenegalSerbiaSierra LeoneSingaporeSomaliaSouth AfricaSouth AmericaSouth Central AsiaSouth Eastern AsiaSouthern EuropeSpainSri LankaSt. Vincent and the GrenadinesSudanSwedenSwitzerlandSyriaTaiwanThailandTrinidad and TobagoTurkeyUgandaUkraineUruguayUzbekistanVenezuelaVietnamWest IndiesWestern AfricaWestern AsiaWestern EuropeYemenZaireZimbabweAzores
Immigrants from Micronesia
Race
Ancestry
AfghanAfricanAlaska NativeAlaskan AthabascanAlbanianAlsatianAmericanApacheArabArapahoArgentineanArmenianAssyrian/Chaldean/SyriacAustralianAustrianBahamianBangladeshiBarbadianBasqueBelgianBelizeanBermudanBhutaneseBlackfeetBolivianBrazilianBritishBritish West IndianBulgarianBurmeseCajunCambodianCanadianCape VerdeanCarpatho RusynCelticCentral AmericanCentral American IndianCherokeeCheyenneChickasawChileanChineseChippewaChoctawColombianColvilleComancheCosta RicanCreeCreekCroatianCrowCubanCypriotCzechCzechoslovakianDanishDelawareDominicanDutchDutch West IndianEastern EuropeanEcuadorianEgyptianEnglishEstonianEthiopianEuropeanFijianFilipinoFinnishFrenchFrench American IndianFrench CanadianGermanGerman RussianGhanaianGreekGuamanian/ChamorroGuatemalanGuyaneseHaitianHmongHonduranHopiHoumaHungarianIcelanderIndian (Asian)IndonesianInupiatIranianIraqiIrishIroquoisIsraeliItalianJamaicanJapaneseJordanianKenyanKiowaKoreanLaotianLatvianLebaneseLiberianLithuanianLumbeeLuxembourgerMacedonianMalaysianMalteseMarshalleseMexicanMexican American IndianMongolianMoroccanNative HawaiianNavajoNepaleseNew ZealanderNicaraguanNigerianNorthern EuropeanNorwegianOkinawanOsageOttawaPaiutePakistaniPalestinianPanamanianParaguayanPennsylvania GermanPeruvianPimaPolishPortuguesePotawatomiPuebloPuerto RicanPuget Sound SalishRomanianRussianSalvadoranSamoanScandinavianScotch-IrishScottishSeminoleSenegaleseSerbianShoshoneSierra LeoneanSiouxSlavicSlovakSloveneSomaliSouth AfricanSouth AmericanSouth American IndianSoviet UnionSpaniardSpanishSpanish AmericanSpanish American IndianSri LankanSubsaharan AfricanSudaneseSwedishSwissSyrianTaiwaneseThaiTlingit-HaidaTohono O'OdhamTonganTrinidadian and TobagonianTsimshianTurkishU.S. Virgin IslanderUgandanUkrainianUruguayanUteVenezuelanVietnameseWelshWest IndianYakamaYaquiYugoslavianYumanYup'ikZimbabwean
Immigration
NonimmigrantsImmigrantsAfghanistanAfricaAlbaniaArgentinaArmeniaAsiaAustraliaAustriaBahamasBangladeshBarbadosBelarusBelgiumBelizeBoliviaBosnia and HerzegovinaBrazilBulgariaBurma/MyanmarCabo VerdeCambodiaCameroonCanadaCaribbeanCentral AmericaChileChinaColombiaCongoCosta RicaCroatiaCubaCzechoslovakiaDenmarkDominicaDominican RepublicEastern AfricaEastern AsiaEastern EuropeEcuadorEgyptEl SalvadorEnglandEritreaEthiopiaEuropeFijiFranceGermanyGhanaGreeceGrenadaGuatemalaGuyanaHaitiHondurasHong KongHungaryIndiaIndonesiaIranIraqIrelandIsraelItalyJamaicaJapanJordanKazakhstanKenyaKoreaKuwaitLaosLatin AmericaLatviaLebanonLiberiaLithuaniaMalaysiaMexicoMicronesiaMiddle AfricaMoldovaMoroccoNepalNetherlandsNicaraguaNigeriaNorth AmericaNorth MacedoniaNorthern AfricaNorthern EuropeNorwayOceaniaPakistanPanamaPeruPhilippinesPolandPortugalRomaniaRussiaSaudi ArabiaScotlandSenegalSerbiaSierra LeoneSingaporeSomaliaSouth AfricaSouth AmericaSouth Central AsiaSouth Eastern AsiaSouthern EuropeSpainSri LankaSt. Vincent and the GrenadinesSudanSwedenSwitzerlandSyriaTaiwanThailandTrinidad and TobagoTurkeyUgandaUkraineUruguayUzbekistanVenezuelaVietnamWest IndiesWestern AfricaWestern AsiaWestern EuropeYemenZaireZimbabweAzores
Unemployment Among Seniors over 75 years
Income
Poverty
Unemployment
Labor Participation
Family Structure
Vehicle Availability
Education Level
Disability

Unemployment Among Seniors over 75 years Comparison

Aleuts

Immigrants from Micronesia

Tragic
Fair
10.3%
UNEMPLOYMENT AMONG SENIORS OVER 75 YEARS
0.0/ 100
METRIC RATING
321st/ 347
METRIC RANK
8.8%
UNEMPLOYMENT AMONG SENIORS OVER 75 YEARS
37.2/ 100
METRIC RATING
184th/ 347
METRIC RANK

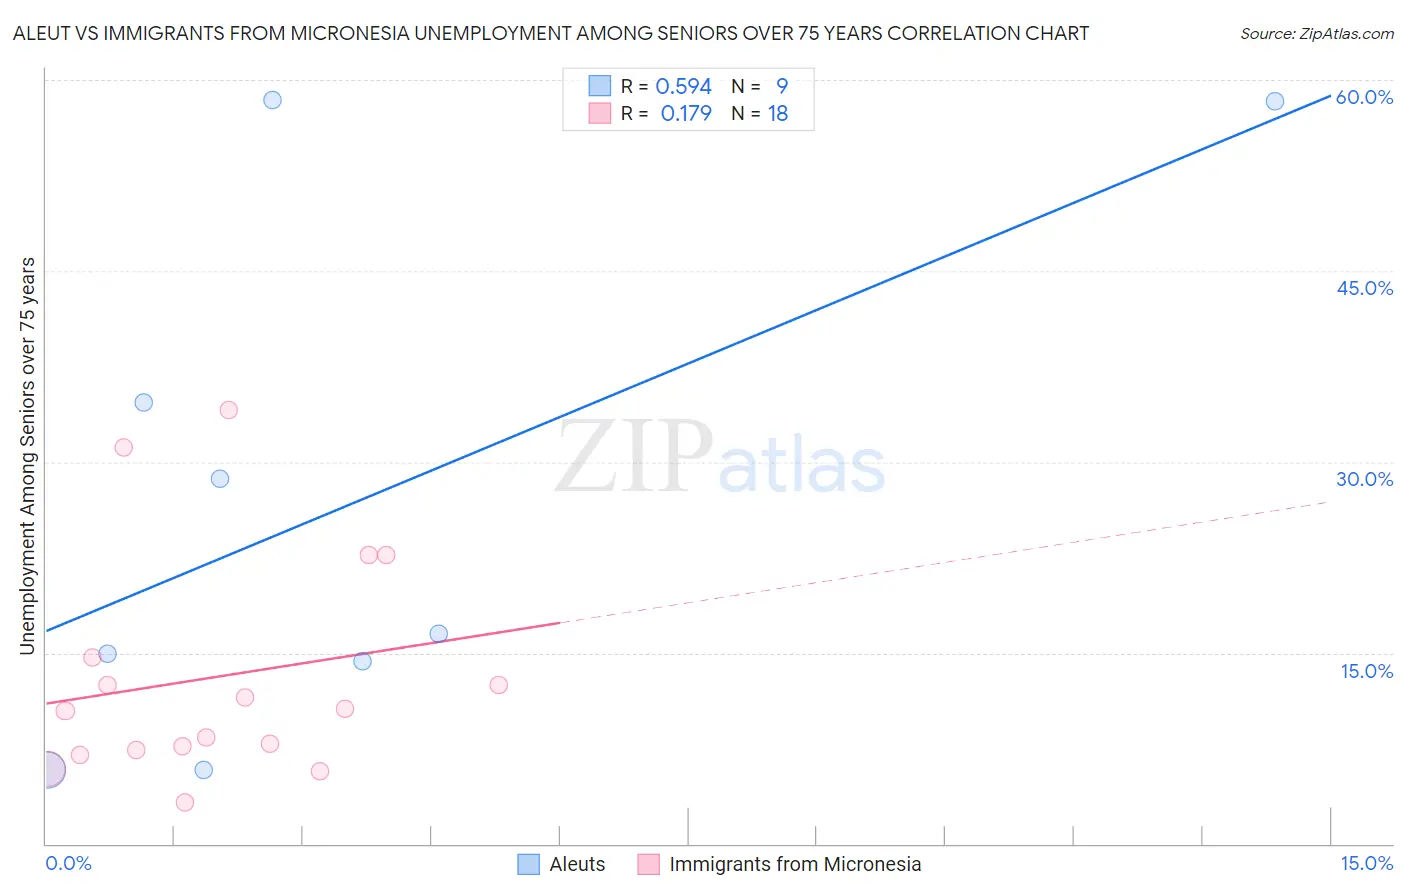
Aleut vs Immigrants from Micronesia Unemployment Among Seniors over 75 years Correlation Chart

The statistical analysis conducted on geographies consisting of 49,450,767 people shows a substantial positive correlation between the proportion of Aleuts and unemployment rate among seniors over the age of 75 in the United States with a correlation coefficient (R) of 0.594 and weighted average of 10.3%. Similarly, the statistical analysis conducted on geographies consisting of 48,327,887 people shows a poor positive correlation between the proportion of Immigrants from Micronesia and unemployment rate among seniors over the age of 75 in the United States with a correlation coefficient (R) of 0.179 and weighted average of 8.8%, a difference of 16.7%.
Aleut vs Immigrants from Micronesia Unemployment Among Seniors over 75 years

Unemployment Among Seniors over 75 years Correlation Summary

MeasurementAleutImmigrants from Micronesia
Minimum5.8%3.3%
Maximum58.4%34.1%
Range52.6%30.8%
Mean26.4%13.1%
Median16.5%10.5%
Interquartile 25% (IQ1)10.0%7.4%
Interquartile 75% (IQ3)46.5%14.6%
Interquartile Range (IQR)36.4%7.2%
Standard Deviation (Sample)20.4%8.8%
Standard Deviation (Population)19.3%8.6%

Similar Demographics by Unemployment Among Seniors over 75 years

Demographics Similar to Aleuts by Unemployment Among Seniors over 75 years

In terms of unemployment among seniors over 75 years, the demographic groups most similar to Aleuts are French (10.3%, a difference of 0.010%), German (10.3%, a difference of 0.23%), Liberian (10.2%, a difference of 0.31%), Polish (10.3%, a difference of 0.35%), and Irish (10.2%, a difference of 0.43%).
DemographicsRating | RankUnemployment Among Seniors over 75 years
Dutch West Indians
0.0
/100
|
#314
Tragic
10.2%
Pennsylvania Germans
0.0
/100
|
#315
Tragic
10.2%
Natives/Alaskans
0.0
/100
|
#316
Tragic
10.2%
Irish
0.0
/100
|
#317
Tragic
10.2%
Liberians
0.0
/100
|
#318
Tragic
10.2%
Germans
0.0
/100
|
#319
Tragic
10.3%
French
0.0
/100
|
#320
Tragic
10.3%
Aleuts
0.0
/100
|
#321
Tragic
10.3%
Poles
0.0
/100
|
#322
Tragic
10.3%
Tongans
0.0
/100
|
#323
Tragic
10.4%
Americans
0.0
/100
|
#324
Tragic
10.4%
Portuguese
0.0
/100
|
#325
Tragic
10.4%
Slovaks
0.0
/100
|
#326
Tragic
10.4%
Dutch
0.0
/100
|
#327
Tragic
10.4%
Immigrants | Portugal
0.0
/100
|
#328
Tragic
10.5%

Demographics Similar to Immigrants from Micronesia by Unemployment Among Seniors over 75 years

In terms of unemployment among seniors over 75 years, the demographic groups most similar to Immigrants from Micronesia are Choctaw (8.8%, a difference of 0.0%), Immigrants from Afghanistan (8.8%, a difference of 0.060%), Immigrants from Ethiopia (8.8%, a difference of 0.060%), Immigrants from Europe (8.8%, a difference of 0.11%), and Guatemalan (8.8%, a difference of 0.13%).
DemographicsRating | RankUnemployment Among Seniors over 75 years
Central Americans
43.3
/100
|
#177
Average
8.8%
West Indians
41.9
/100
|
#178
Average
8.8%
Immigrants | Italy
41.7
/100
|
#179
Average
8.8%
Immigrants | Somalia
41.7
/100
|
#180
Average
8.8%
Immigrants | Thailand
40.2
/100
|
#181
Average
8.8%
Guatemalans
39.5
/100
|
#182
Fair
8.8%
Immigrants | Afghanistan
38.2
/100
|
#183
Fair
8.8%
Immigrants | Micronesia
37.2
/100
|
#184
Fair
8.8%
Choctaw
37.1
/100
|
#185
Fair
8.8%
Immigrants | Ethiopia
36.2
/100
|
#186
Fair
8.8%
Immigrants | Europe
35.2
/100
|
#187
Fair
8.8%
Immigrants | Eastern Europe
34.7
/100
|
#188
Fair
8.8%
Immigrants | Haiti
34.7
/100
|
#189
Fair
8.8%
Mexican American Indians
34.7
/100
|
#190
Fair
8.8%
Estonians
33.3
/100
|
#191
Fair
8.8%