Immigrants from Cameroon vs Scandinavian Unemployment Among Women with Children Under 6 years

COMPARE

Immigrants from Cameroon
Race
Ancestry
AfghanAfricanAlaska NativeAlaskan AthabascanAlbanianAleutAlsatianAmericanApacheArabArapahoArgentineanArmenianAssyrian/Chaldean/SyriacAustralianAustrianBahamianBangladeshiBarbadianBasqueBelgianBelizeanBermudanBhutaneseBlackfeetBolivianBrazilianBritishBritish West IndianBulgarianBurmeseCajunCambodianCanadianCape VerdeanCarpatho RusynCelticCentral AmericanCentral American IndianCherokeeCheyenneChickasawChileanChineseChippewaChoctawColombianColvilleComancheCosta RicanCreeCreekCroatianCrowCubanCypriotCzechCzechoslovakianDanishDelawareDominicanDutchDutch West IndianEastern EuropeanEcuadorianEgyptianEnglishEstonianEthiopianEuropeanFijianFilipinoFinnishFrenchFrench American IndianFrench CanadianGermanGerman RussianGhanaianGreekGuamanian/ChamorroGuatemalanGuyaneseHaitianHmongHonduranHopiHoumaHungarianIcelanderIndian (Asian)IndonesianInupiatIranianIraqiIrishIroquoisIsraeliItalianJamaicanJapaneseJordanianKenyanKiowaKoreanLaotianLatvianLebaneseLiberianLithuanianLumbeeLuxembourgerMacedonianMalaysianMalteseMarshalleseMenomineeMexicanMexican American IndianMongolianMoroccanNative HawaiianNavajoNepaleseNew ZealanderNicaraguanNigerianNorthern EuropeanNorwegianOkinawanOsageOttawaPaiutePakistaniPalestinianPanamanianParaguayanPennsylvania GermanPeruvianPimaPolishPortuguesePotawatomiPuebloPuerto RicanPuget Sound SalishRomanianRussianSalvadoranSamoanScotch-IrishScottishSeminoleSenegaleseSerbianShoshoneSierra LeoneanSiouxSlavicSlovakSloveneSomaliSouth AfricanSouth AmericanSouth American IndianSoviet UnionSpaniardSpanishSpanish AmericanSpanish American IndianSri LankanSubsaharan AfricanSudaneseSwedishSwissSyrianTaiwaneseThaiTlingit-HaidaTohono O'OdhamTonganTrinidadian and TobagonianTsimshianTurkishU.S. Virgin IslanderUgandanUkrainianUruguayanUteVenezuelanVietnameseWelshWest IndianYakamaYaquiYugoslavianYumanYup'ikZimbabwean
Immigration
NonimmigrantsImmigrantsAfghanistanAfricaAlbaniaArgentinaArmeniaAsiaAustraliaAustriaBahamasBangladeshBarbadosBelarusBelgiumBelizeBoliviaBosnia and HerzegovinaBrazilBulgariaBurma/MyanmarCabo VerdeCambodiaCameroonCanadaCaribbeanCentral AmericaChileChinaColombiaCongoCosta RicaCroatiaCubaCzechoslovakiaDenmarkDominicaDominican RepublicEastern AfricaEastern AsiaEastern EuropeEcuadorEgyptEl SalvadorEnglandEritreaEthiopiaEuropeFijiFranceGermanyGhanaGreeceGrenadaGuatemalaGuyanaHaitiHondurasHong KongHungaryIndiaIndonesiaIranIraqIrelandIsraelItalyJamaicaJapanJordanKazakhstanKenyaKoreaKuwaitLaosLatin AmericaLatviaLebanonLiberiaLithuaniaMalaysiaMexicoMicronesiaMiddle AfricaMoldovaMoroccoNepalNetherlandsNicaraguaNigeriaNorth AmericaNorth MacedoniaNorthern AfricaNorthern EuropeNorwayOceaniaPakistanPanamaPeruPhilippinesPolandPortugalRomaniaRussiaSaudi ArabiaScotlandSenegalSerbiaSierra LeoneSingaporeSomaliaSouth AfricaSouth AmericaSouth Central AsiaSouth Eastern AsiaSouthern EuropeSpainSri LankaSt. Vincent and the GrenadinesSudanSwedenSwitzerlandSyriaTaiwanThailandTrinidad and TobagoTurkeyUgandaUkraineUruguayUzbekistanVenezuelaVietnamWest IndiesWestern AfricaWestern AsiaWestern EuropeYemenZaireZimbabweAzores
Scandinavian
Race
Ancestry
AfghanAfricanAlaska NativeAlaskan AthabascanAlbanianAleutAlsatianAmericanApacheArabArapahoArgentineanArmenianAssyrian/Chaldean/SyriacAustralianAustrianBahamianBangladeshiBarbadianBasqueBelgianBelizeanBermudanBhutaneseBlackfeetBolivianBrazilianBritishBritish West IndianBulgarianBurmeseCajunCambodianCanadianCape VerdeanCarpatho RusynCelticCentral AmericanCentral American IndianCherokeeCheyenneChickasawChileanChineseChippewaChoctawColombianColvilleComancheCosta RicanCreeCreekCroatianCrowCubanCypriotCzechCzechoslovakianDanishDelawareDominicanDutchDutch West IndianEastern EuropeanEcuadorianEgyptianEnglishEstonianEthiopianEuropeanFijianFilipinoFinnishFrenchFrench American IndianFrench CanadianGermanGerman RussianGhanaianGreekGuamanian/ChamorroGuatemalanGuyaneseHaitianHmongHonduranHopiHoumaHungarianIcelanderIndian (Asian)IndonesianInupiatIranianIraqiIrishIroquoisIsraeliItalianJamaicanJapaneseJordanianKenyanKiowaKoreanLaotianLatvianLebaneseLiberianLithuanianLumbeeLuxembourgerMacedonianMalaysianMalteseMarshalleseMenomineeMexicanMexican American IndianMongolianMoroccanNative HawaiianNavajoNepaleseNew ZealanderNicaraguanNigerianNorthern EuropeanNorwegianOkinawanOsageOttawaPaiutePakistaniPalestinianPanamanianParaguayanPennsylvania GermanPeruvianPimaPolishPortuguesePotawatomiPuebloPuerto RicanPuget Sound SalishRomanianRussianSalvadoranSamoanScandinavianScotch-IrishScottishSeminoleSenegaleseSerbianShoshoneSierra LeoneanSiouxSlavicSlovakSloveneSomaliSouth AfricanSouth AmericanSouth American IndianSoviet UnionSpaniardSpanishSpanish AmericanSpanish American IndianSri LankanSubsaharan AfricanSudaneseSwedishSwissSyrianTaiwaneseThaiTlingit-HaidaTohono O'OdhamTonganTrinidadian and TobagonianTsimshianTurkishU.S. Virgin IslanderUgandanUkrainianUruguayanUteVenezuelanVietnameseWelshWest IndianYakamaYaquiYugoslavianYumanYup'ikZimbabwean
Immigration
NonimmigrantsImmigrantsAfghanistanAfricaAlbaniaArgentinaArmeniaAsiaAustraliaAustriaBahamasBangladeshBarbadosBelarusBelgiumBelizeBoliviaBosnia and HerzegovinaBrazilBulgariaBurma/MyanmarCabo VerdeCambodiaCanadaCaribbeanCentral AmericaChileChinaColombiaCongoCosta RicaCroatiaCubaCzechoslovakiaDenmarkDominicaDominican RepublicEastern AfricaEastern AsiaEastern EuropeEcuadorEgyptEl SalvadorEnglandEritreaEthiopiaEuropeFijiFranceGermanyGhanaGreeceGrenadaGuatemalaGuyanaHaitiHondurasHong KongHungaryIndiaIndonesiaIranIraqIrelandIsraelItalyJamaicaJapanJordanKazakhstanKenyaKoreaKuwaitLaosLatin AmericaLatviaLebanonLiberiaLithuaniaMalaysiaMexicoMicronesiaMiddle AfricaMoldovaMoroccoNepalNetherlandsNicaraguaNigeriaNorth AmericaNorth MacedoniaNorthern AfricaNorthern EuropeNorwayOceaniaPakistanPanamaPeruPhilippinesPolandPortugalRomaniaRussiaSaudi ArabiaScotlandSenegalSerbiaSierra LeoneSingaporeSomaliaSouth AfricaSouth AmericaSouth Central AsiaSouth Eastern AsiaSouthern EuropeSpainSri LankaSt. Vincent and the GrenadinesSudanSwedenSwitzerlandSyriaTaiwanThailandTrinidad and TobagoTurkeyUgandaUkraineUruguayUzbekistanVenezuelaVietnamWest IndiesWestern AfricaWestern AsiaWestern EuropeYemenZaireZimbabweAzores
Unemployment Among Women with Children Under 6 years
Income
Poverty
Unemployment
Labor Participation
Family Structure
Vehicle Availability
Education Level
Disability

Unemployment Among Women with Children Under 6 years Comparison

Immigrants from Cameroon

Scandinavians

Tragic
Excellent
8.6%
UNEMPLOYMENT AMONG WOMEN WITH CHILDREN UNDER 6 YEARS
0.1/ 100
METRIC RATING
274th/ 347
METRIC RANK
7.4%
UNEMPLOYMENT AMONG WOMEN WITH CHILDREN UNDER 6 YEARS
83.0/ 100
METRIC RATING
140th/ 347
METRIC RANK

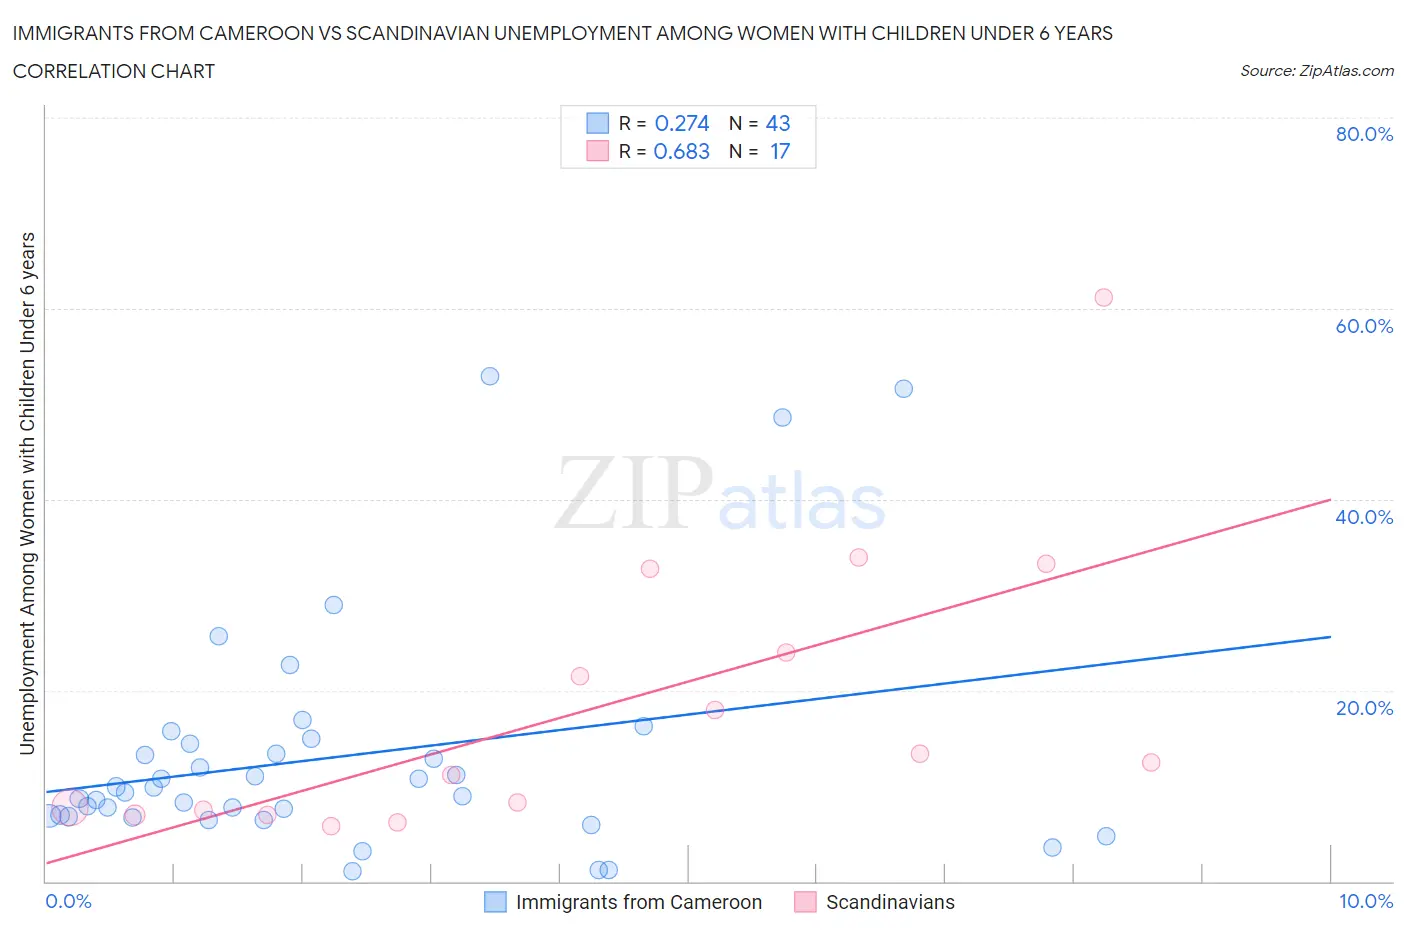
Immigrants from Cameroon vs Scandinavian Unemployment Among Women with Children Under 6 years Correlation Chart

The statistical analysis conducted on geographies consisting of 118,311,400 people shows a weak positive correlation between the proportion of Immigrants from Cameroon and unemployment rate among women with children under the age of 6 in the United States with a correlation coefficient (R) of 0.274 and weighted average of 8.6%. Similarly, the statistical analysis conducted on geographies consisting of 330,455,497 people shows a significant positive correlation between the proportion of Scandinavians and unemployment rate among women with children under the age of 6 in the United States with a correlation coefficient (R) of 0.683 and weighted average of 7.4%, a difference of 15.2%.
Immigrants from Cameroon vs Scandinavian Unemployment Among Women with Children Under 6 years

Unemployment Among Women with Children Under 6 years Correlation Summary

MeasurementImmigrants from CameroonScandinavian
Minimum1.1%5.8%
Maximum52.9%61.1%
Range51.8%55.3%
Mean13.0%18.3%
Median9.3%12.5%
Interquartile 25% (IQ1)6.8%7.2%
Interquartile 75% (IQ3)14.4%28.4%
Interquartile Range (IQR)7.6%21.1%
Standard Deviation (Sample)12.1%14.9%
Standard Deviation (Population)11.9%14.5%

Similar Demographics by Unemployment Among Women with Children Under 6 years

Demographics Similar to Immigrants from Cameroon by Unemployment Among Women with Children Under 6 years

In terms of unemployment among women with children under 6 years, the demographic groups most similar to Immigrants from Cameroon are Immigrants from Latin America (8.6%, a difference of 0.050%), Yaqui (8.6%, a difference of 0.40%), Haitian (8.6%, a difference of 0.50%), Slovak (8.5%, a difference of 0.67%), and Mexican American Indian (8.5%, a difference of 0.75%).
DemographicsRating | RankUnemployment Among Women with Children Under 6 years
Belizeans
0.2
/100
|
#267
Tragic
8.4%
Sub-Saharan Africans
0.2
/100
|
#268
Tragic
8.4%
Immigrants | Haiti
0.2
/100
|
#269
Tragic
8.4%
Immigrants | Senegal
0.2
/100
|
#270
Tragic
8.5%
Immigrants | Congo
0.2
/100
|
#271
Tragic
8.5%
Mexican American Indians
0.1
/100
|
#272
Tragic
8.5%
Slovaks
0.1
/100
|
#273
Tragic
8.5%
Immigrants | Cameroon
0.1
/100
|
#274
Tragic
8.6%
Immigrants | Latin America
0.1
/100
|
#275
Tragic
8.6%
Yaqui
0.0
/100
|
#276
Tragic
8.6%
Haitians
0.0
/100
|
#277
Tragic
8.6%
Immigrants | Dominica
0.0
/100
|
#278
Tragic
8.6%
Immigrants | Guatemala
0.0
/100
|
#279
Tragic
8.6%
Immigrants | Belize
0.0
/100
|
#280
Tragic
8.6%
Guatemalans
0.0
/100
|
#281
Tragic
8.7%

Demographics Similar to Scandinavians by Unemployment Among Women with Children Under 6 years

In terms of unemployment among women with children under 6 years, the demographic groups most similar to Scandinavians are Greek (7.4%, a difference of 0.060%), Immigrants from Colombia (7.4%, a difference of 0.11%), Immigrants from Norway (7.4%, a difference of 0.13%), Immigrants from Argentina (7.5%, a difference of 0.18%), and Immigrants from Cambodia (7.4%, a difference of 0.20%).
DemographicsRating | RankUnemployment Among Women with Children Under 6 years
Immigrants | Uganda
86.5
/100
|
#133
Excellent
7.4%
Immigrants | Bolivia
85.7
/100
|
#134
Excellent
7.4%
Immigrants | Northern Africa
85.3
/100
|
#135
Excellent
7.4%
Immigrants | Morocco
84.9
/100
|
#136
Excellent
7.4%
Immigrants | Cambodia
84.6
/100
|
#137
Excellent
7.4%
Immigrants | Norway
84.1
/100
|
#138
Excellent
7.4%
Immigrants | Colombia
83.9
/100
|
#139
Excellent
7.4%
Scandinavians
83.0
/100
|
#140
Excellent
7.4%
Greeks
82.6
/100
|
#141
Excellent
7.4%
Immigrants | Argentina
81.5
/100
|
#142
Excellent
7.5%
Koreans
81.3
/100
|
#143
Excellent
7.5%
Europeans
79.1
/100
|
#144
Good
7.5%
Immigrants | Jordan
78.9
/100
|
#145
Good
7.5%
Japanese
78.9
/100
|
#146
Good
7.5%
Immigrants | Oceania
78.4
/100
|
#147
Good
7.5%