Immigrants from Cambodia vs Romanian Unemployment Among Ages 65 to 74 years
COMPARE
Immigrants from Cambodia
Romanian
Unemployment Among Ages 65 to 74 years
Unemployment Among Ages 65 to 74 years Comparison
Immigrants from Cambodia
Romanians
5.2%
UNEMPLOYMENT AMONG AGES 65 TO 74 YEARS
96.3/ 100
METRIC RATING
101st/ 347
METRIC RANK
5.2%
UNEMPLOYMENT AMONG AGES 65 TO 74 YEARS
97.4/ 100
METRIC RATING
91st/ 347
METRIC RANK
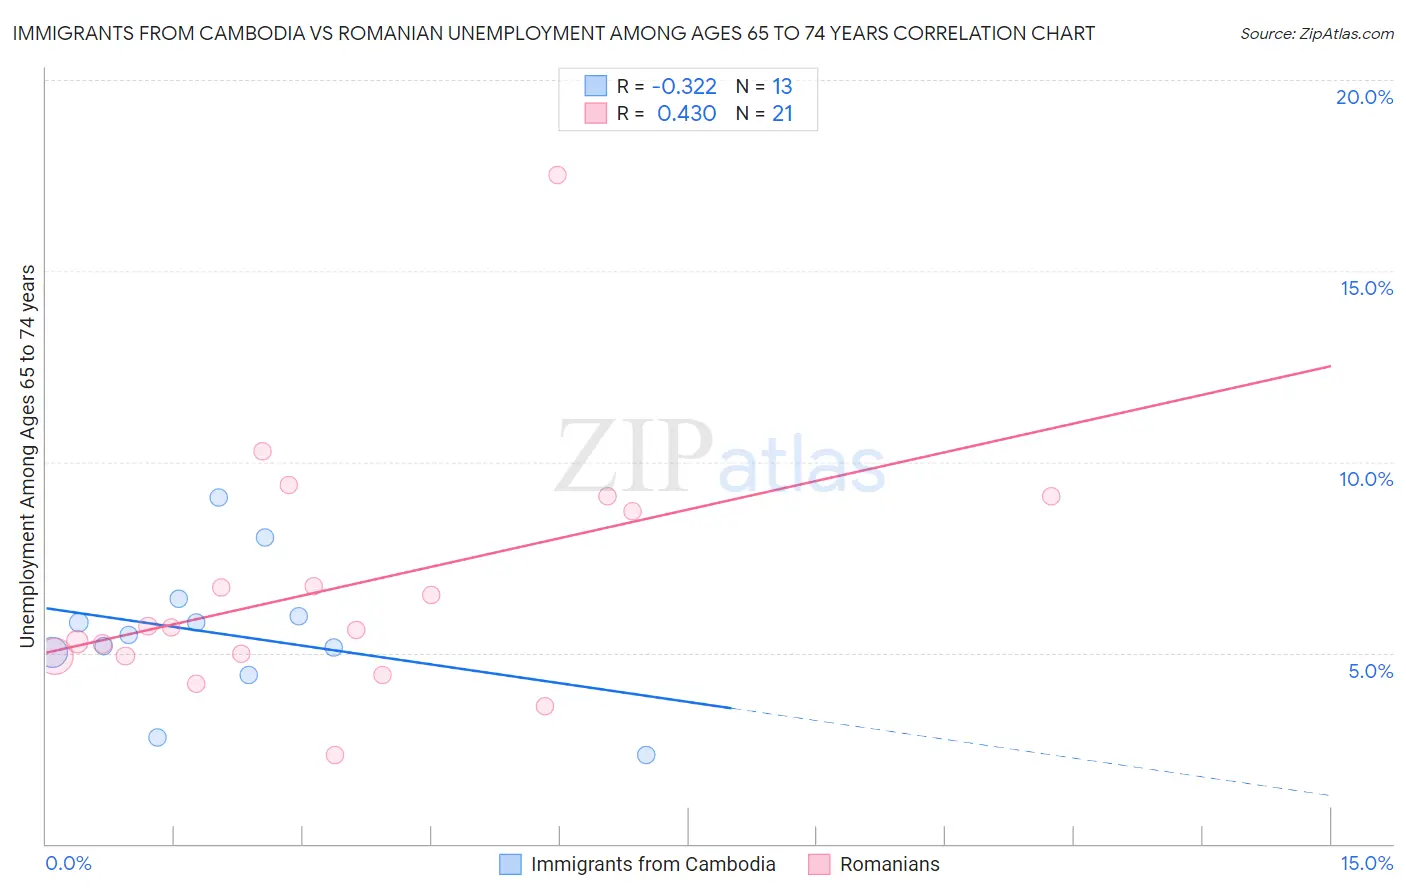
Immigrants from Cambodia vs Romanian Unemployment Among Ages 65 to 74 years Correlation Chart
The statistical analysis conducted on geographies consisting of 192,440,418 people shows a mild negative correlation between the proportion of Immigrants from Cambodia and unemployment rate among population between the ages 65 and 74 in the United States with a correlation coefficient (R) of -0.322 and weighted average of 5.2%. Similarly, the statistical analysis conducted on geographies consisting of 334,573,451 people shows a moderate positive correlation between the proportion of Romanians and unemployment rate among population between the ages 65 and 74 in the United States with a correlation coefficient (R) of 0.430 and weighted average of 5.2%, a difference of 0.29%.
Unemployment Among Ages 65 to 74 years Correlation Summary
| Measurement | Immigrants from Cambodia | Romanian |
| Minimum | 2.3% | 2.3% |
| Maximum | 9.1% | 17.5% |
| Range | 6.7% | 15.2% |
| Mean | 5.5% | 6.7% |
| Median | 5.5% | 5.7% |
| Interquartile 25% (IQ1) | 4.7% | 4.9% |
| Interquartile 75% (IQ3) | 6.2% | 8.9% |
| Interquartile Range (IQR) | 1.5% | 4.0% |
| Standard Deviation (Sample) | 1.8% | 3.2% |
| Standard Deviation (Population) | 1.7% | 3.2% |
Demographics Similar to Immigrants from Cambodia and Romanians by Unemployment Among Ages 65 to 74 years
In terms of unemployment among ages 65 to 74 years, the demographic groups most similar to Immigrants from Cambodia are Japanese (5.2%, a difference of 0.0%), Burmese (5.2%, a difference of 0.020%), Welsh (5.2%, a difference of 0.040%), Senegalese (5.2%, a difference of 0.050%), and Immigrants from Lithuania (5.2%, a difference of 0.10%). Similarly, the demographic groups most similar to Romanians are Puget Sound Salish (5.2%, a difference of 0.030%), Immigrants from Netherlands (5.2%, a difference of 0.080%), Luxembourger (5.2%, a difference of 0.090%), South African (5.2%, a difference of 0.10%), and Serbian (5.2%, a difference of 0.11%).
| Demographics | Rating | Rank | Unemployment Among Ages 65 to 74 years |
| Danes | 97.9 /100 | #86 | Exceptional 5.2% |
| Scottish | 97.9 /100 | #87 | Exceptional 5.2% |
| Immigrants | Saudi Arabia | 97.9 /100 | #88 | Exceptional 5.2% |
| English | 97.8 /100 | #89 | Exceptional 5.2% |
| Luxembourgers | 97.6 /100 | #90 | Exceptional 5.2% |
| Romanians | 97.4 /100 | #91 | Exceptional 5.2% |
| Puget Sound Salish | 97.3 /100 | #92 | Exceptional 5.2% |
| Immigrants | Netherlands | 97.1 /100 | #93 | Exceptional 5.2% |
| South Africans | 97.1 /100 | #94 | Exceptional 5.2% |
| Serbians | 97.0 /100 | #95 | Exceptional 5.2% |
| Immigrants | Thailand | 97.0 /100 | #96 | Exceptional 5.2% |
| Senegalese | 96.5 /100 | #97 | Exceptional 5.2% |
| Welsh | 96.5 /100 | #98 | Exceptional 5.2% |
| Burmese | 96.4 /100 | #99 | Exceptional 5.2% |
| Japanese | 96.4 /100 | #100 | Exceptional 5.2% |
| Immigrants | Cambodia | 96.3 /100 | #101 | Exceptional 5.2% |
| Immigrants | Lithuania | 95.9 /100 | #102 | Exceptional 5.2% |
| Immigrants | Vietnam | 95.6 /100 | #103 | Exceptional 5.2% |
| Yugoslavians | 95.5 /100 | #104 | Exceptional 5.2% |
| Iranians | 95.2 /100 | #105 | Exceptional 5.2% |
| Malaysians | 95.1 /100 | #106 | Exceptional 5.2% |