Immigrants from Cambodia vs Immigrants from Italy Unemployment Among Ages 65 to 74 years

COMPARE

Immigrants from Cambodia
Race
Ancestry
AfghanAfricanAlaska NativeAlaskan AthabascanAlbanianAleutAlsatianAmericanApacheArabArapahoArgentineanArmenianAssyrian/Chaldean/SyriacAustralianAustrianBahamianBangladeshiBarbadianBasqueBelgianBelizeanBermudanBhutaneseBlackfeetBolivianBrazilianBritishBritish West IndianBulgarianBurmeseCajunCambodianCanadianCape VerdeanCarpatho RusynCelticCentral AmericanCentral American IndianCherokeeCheyenneChickasawChileanChineseChippewaChoctawColombianColvilleComancheCosta RicanCreeCreekCroatianCrowCubanCypriotCzechCzechoslovakianDanishDelawareDominicanDutchDutch West IndianEastern EuropeanEcuadorianEgyptianEnglishEstonianEthiopianEuropeanFijianFilipinoFinnishFrenchFrench American IndianFrench CanadianGermanGerman RussianGhanaianGreekGuamanian/ChamorroGuatemalanGuyaneseHaitianHmongHonduranHopiHoumaHungarianIcelanderIndian (Asian)IndonesianInupiatIranianIraqiIrishIroquoisIsraeliItalianJamaicanJapaneseJordanianKenyanKiowaKoreanLaotianLatvianLebaneseLiberianLithuanianLumbeeLuxembourgerMacedonianMalaysianMalteseMarshalleseMenomineeMexicanMexican American IndianMongolianMoroccanNative HawaiianNavajoNepaleseNew ZealanderNicaraguanNigerianNorthern EuropeanNorwegianOkinawanOsageOttawaPaiutePakistaniPalestinianPanamanianParaguayanPennsylvania GermanPeruvianPimaPolishPortuguesePotawatomiPuebloPuerto RicanPuget Sound SalishRomanianRussianSalvadoranSamoanScandinavianScotch-IrishScottishSeminoleSenegaleseSerbianShoshoneSierra LeoneanSiouxSlavicSlovakSloveneSomaliSouth AfricanSouth AmericanSouth American IndianSoviet UnionSpaniardSpanishSpanish AmericanSpanish American IndianSri LankanSubsaharan AfricanSudaneseSwedishSwissSyrianTaiwaneseThaiTlingit-HaidaTohono O'OdhamTonganTrinidadian and TobagonianTsimshianTurkishU.S. Virgin IslanderUgandanUkrainianUruguayanUteVenezuelanVietnameseWelshWest IndianYakamaYaquiYugoslavianYumanYup'ikZimbabwean
Immigration
NonimmigrantsImmigrantsAfghanistanAfricaAlbaniaArgentinaArmeniaAsiaAustraliaAustriaBahamasBangladeshBarbadosBelarusBelgiumBelizeBoliviaBosnia and HerzegovinaBrazilBulgariaBurma/MyanmarCabo VerdeCambodiaCameroonCanadaCaribbeanCentral AmericaChileChinaColombiaCongoCosta RicaCroatiaCubaCzechoslovakiaDenmarkDominicaDominican RepublicEastern AfricaEastern AsiaEastern EuropeEcuadorEgyptEl SalvadorEnglandEritreaEthiopiaEuropeFijiFranceGermanyGhanaGreeceGrenadaGuatemalaGuyanaHaitiHondurasHong KongHungaryIndiaIndonesiaIranIraqIrelandIsraelJamaicaJapanJordanKazakhstanKenyaKoreaKuwaitLaosLatin AmericaLatviaLebanonLiberiaLithuaniaMalaysiaMexicoMicronesiaMiddle AfricaMoldovaMoroccoNepalNetherlandsNicaraguaNigeriaNorth AmericaNorth MacedoniaNorthern AfricaNorthern EuropeNorwayOceaniaPakistanPanamaPeruPhilippinesPolandPortugalRomaniaRussiaSaudi ArabiaScotlandSenegalSerbiaSierra LeoneSingaporeSomaliaSouth AfricaSouth AmericaSouth Central AsiaSouth Eastern AsiaSouthern EuropeSpainSri LankaSt. Vincent and the GrenadinesSudanSwedenSwitzerlandSyriaTaiwanThailandTrinidad and TobagoTurkeyUgandaUkraineUruguayUzbekistanVenezuelaVietnamWest IndiesWestern AfricaWestern AsiaWestern EuropeYemenZaireZimbabweAzores
Immigrants from Italy
Race
Ancestry
AfghanAfricanAlaska NativeAlaskan AthabascanAlbanianAleutAlsatianAmericanApacheArabArapahoArgentineanArmenianAssyrian/Chaldean/SyriacAustralianAustrianBahamianBangladeshiBarbadianBasqueBelgianBelizeanBermudanBhutaneseBlackfeetBolivianBrazilianBritishBritish West IndianBulgarianBurmeseCajunCambodianCanadianCape VerdeanCarpatho RusynCelticCentral AmericanCentral American IndianCherokeeCheyenneChickasawChileanChineseChippewaChoctawColombianColvilleComancheCosta RicanCreeCreekCroatianCrowCubanCypriotCzechCzechoslovakianDanishDelawareDominicanDutchDutch West IndianEastern EuropeanEcuadorianEgyptianEnglishEstonianEthiopianEuropeanFijianFilipinoFinnishFrenchFrench American IndianFrench CanadianGermanGerman RussianGhanaianGreekGuamanian/ChamorroGuatemalanGuyaneseHaitianHmongHonduranHopiHoumaHungarianIcelanderIndian (Asian)IndonesianInupiatIranianIraqiIrishIroquoisIsraeliItalianJamaicanJapaneseJordanianKenyanKiowaKoreanLaotianLatvianLebaneseLiberianLithuanianLumbeeLuxembourgerMacedonianMalaysianMalteseMarshalleseMenomineeMexicanMexican American IndianMongolianMoroccanNative HawaiianNavajoNepaleseNew ZealanderNicaraguanNigerianNorthern EuropeanNorwegianOkinawanOsageOttawaPaiutePakistaniPalestinianPanamanianParaguayanPennsylvania GermanPeruvianPimaPolishPortuguesePotawatomiPuebloPuerto RicanPuget Sound SalishRomanianRussianSalvadoranSamoanScandinavianScotch-IrishScottishSeminoleSenegaleseSerbianShoshoneSierra LeoneanSiouxSlavicSlovakSloveneSomaliSouth AfricanSouth AmericanSouth American IndianSoviet UnionSpaniardSpanishSpanish AmericanSpanish American IndianSri LankanSubsaharan AfricanSudaneseSwedishSwissSyrianTaiwaneseThaiTlingit-HaidaTohono O'OdhamTonganTrinidadian and TobagonianTsimshianTurkishU.S. Virgin IslanderUgandanUkrainianUruguayanUteVenezuelanVietnameseWelshWest IndianYakamaYaquiYugoslavianYumanYup'ikZimbabwean
Immigration
NonimmigrantsImmigrantsAfghanistanAfricaAlbaniaArgentinaArmeniaAsiaAustraliaAustriaBahamasBangladeshBarbadosBelarusBelgiumBelizeBoliviaBosnia and HerzegovinaBrazilBulgariaBurma/MyanmarCabo VerdeCameroonCanadaCaribbeanCentral AmericaChileChinaColombiaCongoCosta RicaCroatiaCubaCzechoslovakiaDenmarkDominicaDominican RepublicEastern AfricaEastern AsiaEastern EuropeEcuadorEgyptEl SalvadorEnglandEritreaEthiopiaEuropeFijiFranceGermanyGhanaGreeceGrenadaGuatemalaGuyanaHaitiHondurasHong KongHungaryIndiaIndonesiaIranIraqIrelandIsraelItalyJamaicaJapanJordanKazakhstanKenyaKoreaKuwaitLaosLatin AmericaLatviaLebanonLiberiaLithuaniaMalaysiaMexicoMicronesiaMiddle AfricaMoldovaMoroccoNepalNetherlandsNicaraguaNigeriaNorth AmericaNorth MacedoniaNorthern AfricaNorthern EuropeNorwayOceaniaPakistanPanamaPeruPhilippinesPolandPortugalRomaniaRussiaSaudi ArabiaScotlandSenegalSerbiaSierra LeoneSingaporeSomaliaSouth AfricaSouth AmericaSouth Central AsiaSouth Eastern AsiaSouthern EuropeSpainSri LankaSt. Vincent and the GrenadinesSudanSwedenSwitzerlandSyriaTaiwanThailandTrinidad and TobagoTurkeyUgandaUkraineUruguayUzbekistanVenezuelaVietnamWest IndiesWestern AfricaWestern AsiaWestern EuropeYemenZaireZimbabweAzores
Unemployment Among Ages 65 to 74 years
Income
Poverty
Unemployment
Labor Participation
Family Structure
Vehicle Availability
Education Level
Disability

Unemployment Among Ages 65 to 74 years Comparison

Immigrants from Cambodia

Immigrants from Italy

Exceptional
Good
5.2%
UNEMPLOYMENT AMONG AGES 65 TO 74 YEARS
96.3/ 100
METRIC RATING
101st/ 347
METRIC RANK
5.3%
UNEMPLOYMENT AMONG AGES 65 TO 74 YEARS
63.7/ 100
METRIC RATING
161st/ 347
METRIC RANK

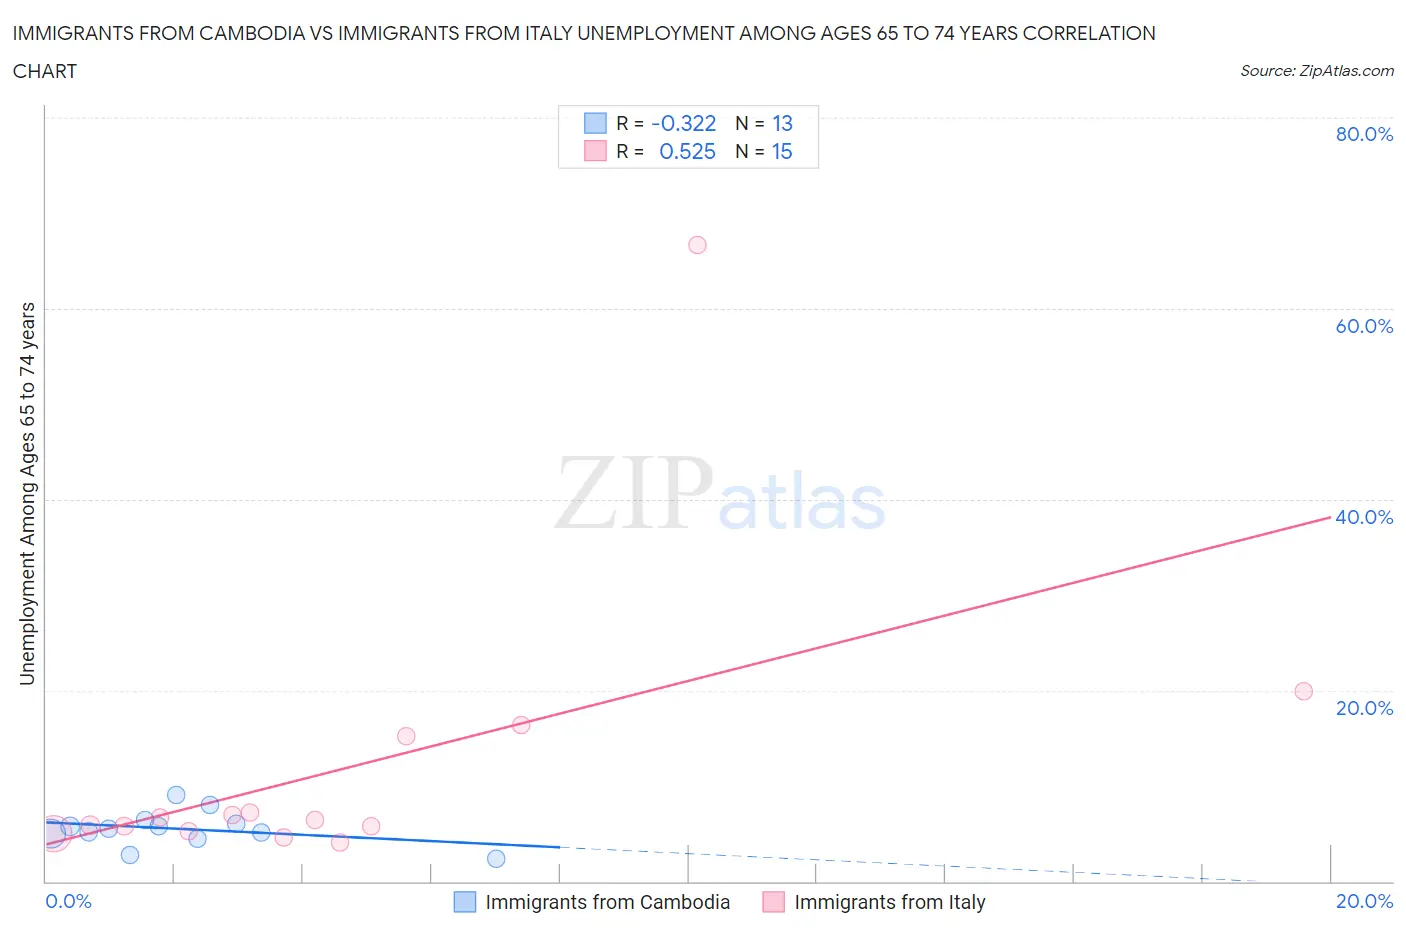
Immigrants from Cambodia vs Immigrants from Italy Unemployment Among Ages 65 to 74 years Correlation Chart

The statistical analysis conducted on geographies consisting of 192,440,418 people shows a mild negative correlation between the proportion of Immigrants from Cambodia and unemployment rate among population between the ages 65 and 74 in the United States with a correlation coefficient (R) of -0.322 and weighted average of 5.2%. Similarly, the statistical analysis conducted on geographies consisting of 295,864,896 people shows a substantial positive correlation between the proportion of Immigrants from Italy and unemployment rate among population between the ages 65 and 74 in the United States with a correlation coefficient (R) of 0.525 and weighted average of 5.3%, a difference of 2.3%.
Immigrants from Cambodia vs Immigrants from Italy Unemployment Among Ages 65 to 74 years

Unemployment Among Ages 65 to 74 years Correlation Summary

MeasurementImmigrants from CambodiaImmigrants from Italy
Minimum2.3%4.0%
Maximum9.1%66.7%
Range6.7%62.7%
Mean5.5%12.1%
Median5.5%6.5%
Interquartile 25% (IQ1)4.7%5.2%
Interquartile 75% (IQ3)6.2%15.2%
Interquartile Range (IQR)1.5%10.0%
Standard Deviation (Sample)1.8%15.9%
Standard Deviation (Population)1.7%15.3%

Similar Demographics by Unemployment Among Ages 65 to 74 years

Demographics Similar to Immigrants from Cambodia by Unemployment Among Ages 65 to 74 years

In terms of unemployment among ages 65 to 74 years, the demographic groups most similar to Immigrants from Cambodia are Japanese (5.2%, a difference of 0.0%), Burmese (5.2%, a difference of 0.020%), Welsh (5.2%, a difference of 0.040%), Senegalese (5.2%, a difference of 0.050%), and Immigrants from Lithuania (5.2%, a difference of 0.10%).
DemographicsRating | RankUnemployment Among Ages 65 to 74 years
South Africans
97.1
/100
|
#94
Exceptional
5.2%
Serbians
97.0
/100
|
#95
Exceptional
5.2%
Immigrants | Thailand
97.0
/100
|
#96
Exceptional
5.2%
Senegalese
96.5
/100
|
#97
Exceptional
5.2%
Welsh
96.5
/100
|
#98
Exceptional
5.2%
Burmese
96.4
/100
|
#99
Exceptional
5.2%
Japanese
96.4
/100
|
#100
Exceptional
5.2%
Immigrants | Cambodia
96.3
/100
|
#101
Exceptional
5.2%
Immigrants | Lithuania
95.9
/100
|
#102
Exceptional
5.2%
Immigrants | Vietnam
95.6
/100
|
#103
Exceptional
5.2%
Yugoslavians
95.5
/100
|
#104
Exceptional
5.2%
Iranians
95.2
/100
|
#105
Exceptional
5.2%
Malaysians
95.1
/100
|
#106
Exceptional
5.2%
Austrians
94.5
/100
|
#107
Exceptional
5.2%
Immigrants | Malaysia
94.1
/100
|
#108
Exceptional
5.2%

Demographics Similar to Immigrants from Italy by Unemployment Among Ages 65 to 74 years

In terms of unemployment among ages 65 to 74 years, the demographic groups most similar to Immigrants from Italy are Immigrants from Eastern Asia (5.3%, a difference of 0.040%), Mongolian (5.3%, a difference of 0.050%), Bangladeshi (5.3%, a difference of 0.070%), Immigrants from Philippines (5.3%, a difference of 0.090%), and Immigrants from Czechoslovakia (5.3%, a difference of 0.10%).
DemographicsRating | RankUnemployment Among Ages 65 to 74 years
Poles
72.4
/100
|
#154
Good
5.3%
Immigrants | Cameroon
72.1
/100
|
#155
Good
5.3%
Dutch
72.0
/100
|
#156
Good
5.3%
Immigrants | Eastern Europe
71.5
/100
|
#157
Good
5.3%
Immigrants | France
71.0
/100
|
#158
Good
5.3%
Immigrants | Czechoslovakia
66.3
/100
|
#159
Good
5.3%
Bangladeshis
65.8
/100
|
#160
Good
5.3%
Immigrants | Italy
63.7
/100
|
#161
Good
5.3%
Immigrants | Eastern Asia
62.5
/100
|
#162
Good
5.3%
Mongolians
62.3
/100
|
#163
Good
5.3%
Immigrants | Philippines
61.2
/100
|
#164
Good
5.3%
Immigrants | Bosnia and Herzegovina
60.2
/100
|
#165
Good
5.3%
Slovaks
60.0
/100
|
#166
Good
5.3%
Indians (Asian)
59.9
/100
|
#167
Average
5.3%
Whites/Caucasians
57.2
/100
|
#168
Average
5.4%