Immigrants from Cambodia vs Immigrants from Singapore Unemployment Among Women with Children Under 6 years
COMPARE
Immigrants from Cambodia
Immigrants from Singapore
Unemployment Among Women with Children Under 6 years
Unemployment Among Women with Children Under 6 years Comparison
Immigrants from Cambodia
Immigrants from Singapore
7.4%
UNEMPLOYMENT AMONG WOMEN WITH CHILDREN UNDER 6 YEARS
84.6/ 100
METRIC RATING
137th/ 347
METRIC RANK
6.3%
UNEMPLOYMENT AMONG WOMEN WITH CHILDREN UNDER 6 YEARS
100.0/ 100
METRIC RATING
12th/ 347
METRIC RANK
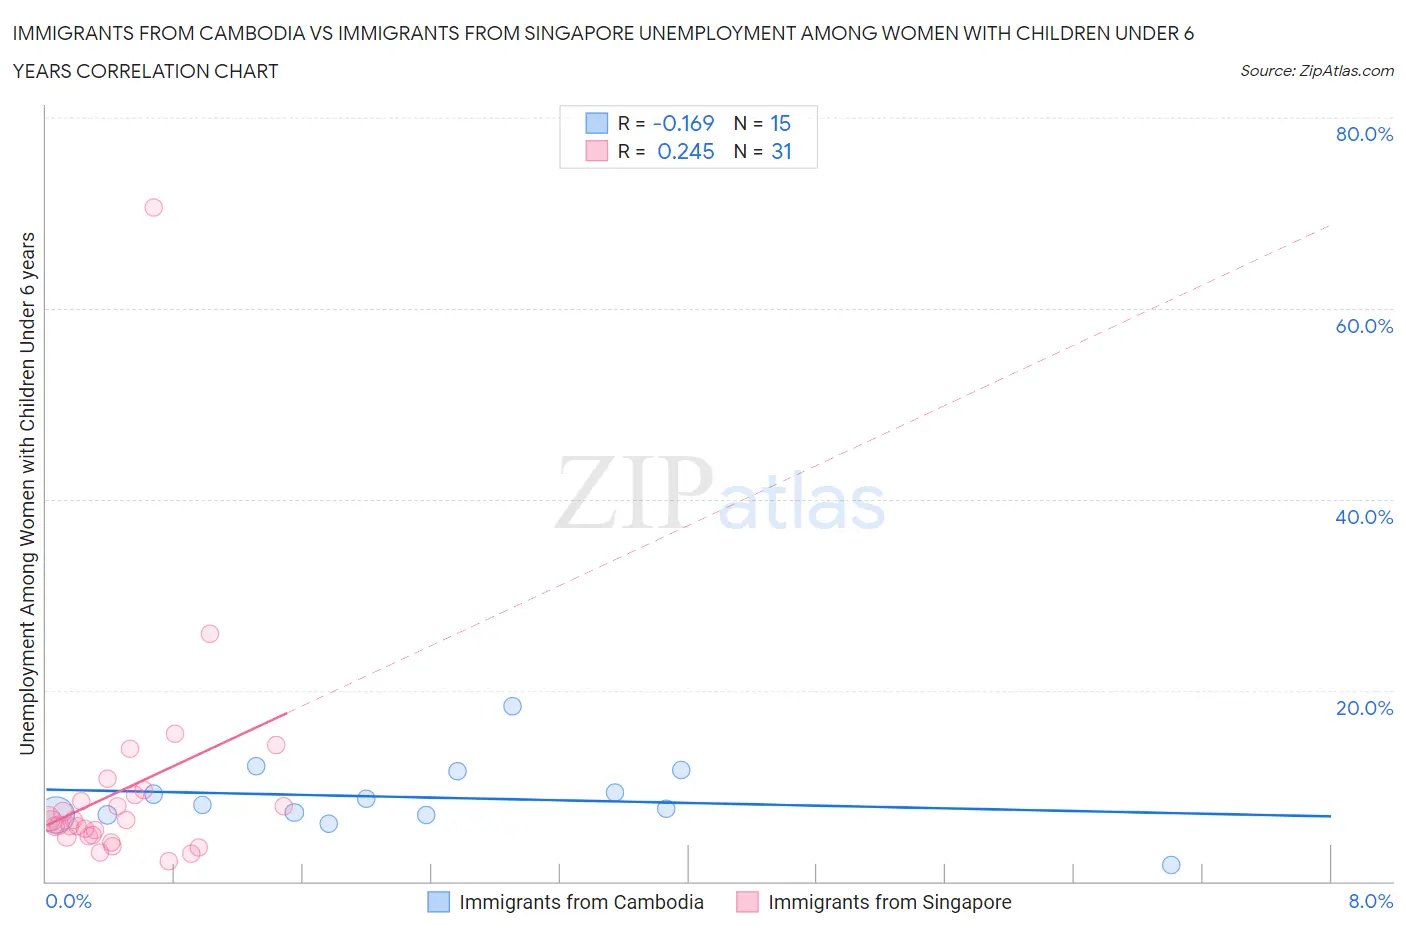
Immigrants from Cambodia vs Immigrants from Singapore Unemployment Among Women with Children Under 6 years Correlation Chart
The statistical analysis conducted on geographies consisting of 176,492,322 people shows a poor negative correlation between the proportion of Immigrants from Cambodia and unemployment rate among women with children under the age of 6 in the United States with a correlation coefficient (R) of -0.169 and weighted average of 7.4%. Similarly, the statistical analysis conducted on geographies consisting of 121,514,852 people shows a weak positive correlation between the proportion of Immigrants from Singapore and unemployment rate among women with children under the age of 6 in the United States with a correlation coefficient (R) of 0.245 and weighted average of 6.3%, a difference of 17.9%.
Unemployment Among Women with Children Under 6 years Correlation Summary
| Measurement | Immigrants from Cambodia | Immigrants from Singapore |
| Minimum | 1.7% | 2.1% |
| Maximum | 18.4% | 70.6% |
| Range | 16.7% | 68.5% |
| Mean | 8.8% | 9.5% |
| Median | 8.0% | 6.3% |
| Interquartile 25% (IQ1) | 6.9% | 4.7% |
| Interquartile 75% (IQ3) | 11.5% | 9.0% |
| Interquartile Range (IQR) | 4.5% | 4.4% |
| Standard Deviation (Sample) | 3.7% | 12.3% |
| Standard Deviation (Population) | 3.6% | 12.1% |
Similar Demographics by Unemployment Among Women with Children Under 6 years
Demographics Similar to Immigrants from Cambodia by Unemployment Among Women with Children Under 6 years
In terms of unemployment among women with children under 6 years, the demographic groups most similar to Immigrants from Cambodia are Immigrants from Morocco (7.4%, a difference of 0.030%), Immigrants from Norway (7.4%, a difference of 0.070%), Immigrants from Northern Africa (7.4%, a difference of 0.090%), Immigrants from Colombia (7.4%, a difference of 0.090%), and Immigrants from Bolivia (7.4%, a difference of 0.15%).
| Demographics | Rating | Rank | Unemployment Among Women with Children Under 6 years |
| Swedes | 88.4 /100 | #130 | Excellent 7.4% |
| Ukrainians | 88.2 /100 | #131 | Excellent 7.4% |
| Immigrants | Armenia | 87.4 /100 | #132 | Excellent 7.4% |
| Immigrants | Uganda | 86.5 /100 | #133 | Excellent 7.4% |
| Immigrants | Bolivia | 85.7 /100 | #134 | Excellent 7.4% |
| Immigrants | Northern Africa | 85.3 /100 | #135 | Excellent 7.4% |
| Immigrants | Morocco | 84.9 /100 | #136 | Excellent 7.4% |
| Immigrants | Cambodia | 84.6 /100 | #137 | Excellent 7.4% |
| Immigrants | Norway | 84.1 /100 | #138 | Excellent 7.4% |
| Immigrants | Colombia | 83.9 /100 | #139 | Excellent 7.4% |
| Scandinavians | 83.0 /100 | #140 | Excellent 7.4% |
| Greeks | 82.6 /100 | #141 | Excellent 7.4% |
| Immigrants | Argentina | 81.5 /100 | #142 | Excellent 7.5% |
| Koreans | 81.3 /100 | #143 | Excellent 7.5% |
| Europeans | 79.1 /100 | #144 | Good 7.5% |
Demographics Similar to Immigrants from Singapore by Unemployment Among Women with Children Under 6 years
In terms of unemployment among women with children under 6 years, the demographic groups most similar to Immigrants from Singapore are Indian (Asian) (6.3%, a difference of 0.020%), Immigrants from Eastern Asia (6.3%, a difference of 0.050%), Immigrants from Bulgaria (6.3%, a difference of 0.37%), Thai (6.3%, a difference of 0.48%), and Immigrants from Uzbekistan (6.3%, a difference of 0.78%).
| Demographics | Rating | Rank | Unemployment Among Women with Children Under 6 years |
| Cape Verdeans | 100.0 /100 | #5 | Exceptional 5.9% |
| Immigrants | Taiwan | 100.0 /100 | #6 | Exceptional 6.0% |
| Taiwanese | 100.0 /100 | #7 | Exceptional 6.1% |
| Immigrants | India | 100.0 /100 | #8 | Exceptional 6.1% |
| Filipinos | 100.0 /100 | #9 | Exceptional 6.1% |
| Immigrants | China | 100.0 /100 | #10 | Exceptional 6.2% |
| Indians (Asian) | 100.0 /100 | #11 | Exceptional 6.3% |
| Immigrants | Singapore | 100.0 /100 | #12 | Exceptional 6.3% |
| Immigrants | Eastern Asia | 100.0 /100 | #13 | Exceptional 6.3% |
| Immigrants | Bulgaria | 100.0 /100 | #14 | Exceptional 6.3% |
| Thais | 100.0 /100 | #15 | Exceptional 6.3% |
| Immigrants | Uzbekistan | 100.0 /100 | #16 | Exceptional 6.3% |
| Immigrants | Malaysia | 100.0 /100 | #17 | Exceptional 6.4% |
| Assyrians/Chaldeans/Syriacs | 100.0 /100 | #18 | Exceptional 6.5% |
| Mongolians | 100.0 /100 | #19 | Exceptional 6.5% |