Immigrants from Bulgaria vs Okinawan Unemployment Among Ages 30 to 34 years
COMPARE
Immigrants from Bulgaria
Okinawan
Unemployment Among Ages 30 to 34 years
Unemployment Among Ages 30 to 34 years Comparison
Immigrants from Bulgaria
Okinawans
4.8%
UNEMPLOYMENT AMONG AGES 30 TO 34 YEARS
99.9/ 100
METRIC RATING
17th/ 347
METRIC RANK
4.8%
UNEMPLOYMENT AMONG AGES 30 TO 34 YEARS
99.9/ 100
METRIC RATING
15th/ 347
METRIC RANK
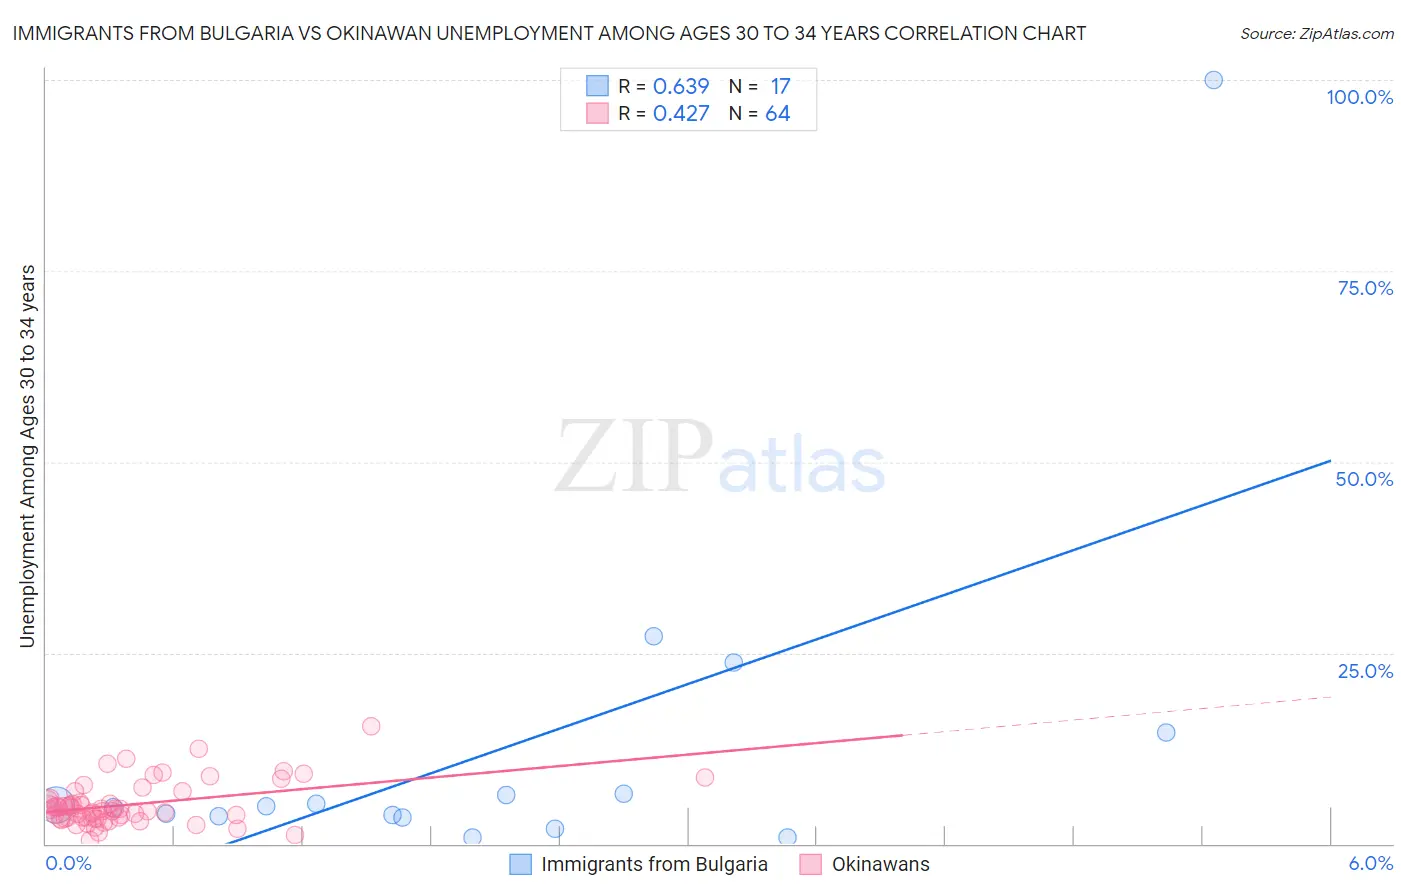
Immigrants from Bulgaria vs Okinawan Unemployment Among Ages 30 to 34 years Correlation Chart
The statistical analysis conducted on geographies consisting of 168,277,056 people shows a significant positive correlation between the proportion of Immigrants from Bulgaria and unemployment rate among population between the ages 30 and 34 in the United States with a correlation coefficient (R) of 0.639 and weighted average of 4.8%. Similarly, the statistical analysis conducted on geographies consisting of 72,910,776 people shows a moderate positive correlation between the proportion of Okinawans and unemployment rate among population between the ages 30 and 34 in the United States with a correlation coefficient (R) of 0.427 and weighted average of 4.8%, a difference of 0.22%.
Unemployment Among Ages 30 to 34 years Correlation Summary
| Measurement | Immigrants from Bulgaria | Okinawan |
| Minimum | 0.80% | 0.50% |
| Maximum | 100.0% | 15.4% |
| Range | 99.2% | 14.9% |
| Mean | 12.8% | 5.1% |
| Median | 4.9% | 4.5% |
| Interquartile 25% (IQ1) | 3.5% | 3.4% |
| Interquartile 75% (IQ3) | 10.5% | 5.7% |
| Interquartile Range (IQR) | 7.1% | 2.4% |
| Standard Deviation (Sample) | 23.7% | 2.8% |
| Standard Deviation (Population) | 23.0% | 2.8% |
Demographics Similar to Immigrants from Bulgaria and Okinawans by Unemployment Among Ages 30 to 34 years
In terms of unemployment among ages 30 to 34 years, the demographic groups most similar to Immigrants from Bulgaria are Zimbabwean (4.8%, a difference of 0.11%), Bolivian (4.9%, a difference of 0.40%), Immigrants from Sudan (4.9%, a difference of 0.46%), Immigrants from Taiwan (4.9%, a difference of 0.48%), and Ethiopian (4.9%, a difference of 0.49%). Similarly, the demographic groups most similar to Okinawans are Zimbabwean (4.8%, a difference of 0.11%), Luxembourger (4.8%, a difference of 0.37%), Cambodian (4.8%, a difference of 0.38%), Filipino (4.8%, a difference of 0.39%), and Bolivian (4.9%, a difference of 0.62%).
| Demographics | Rating | Rank | Unemployment Among Ages 30 to 34 years |
| Immigrants | Bosnia and Herzegovina | 100.0 /100 | #6 | Exceptional 4.7% |
| Thais | 100.0 /100 | #7 | Exceptional 4.7% |
| Immigrants | Eritrea | 100.0 /100 | #8 | Exceptional 4.7% |
| Bulgarians | 99.9 /100 | #9 | Exceptional 4.7% |
| Tongans | 99.9 /100 | #10 | Exceptional 4.8% |
| Immigrants | Bolivia | 99.9 /100 | #11 | Exceptional 4.8% |
| Filipinos | 99.9 /100 | #12 | Exceptional 4.8% |
| Cambodians | 99.9 /100 | #13 | Exceptional 4.8% |
| Luxembourgers | 99.9 /100 | #14 | Exceptional 4.8% |
| Okinawans | 99.9 /100 | #15 | Exceptional 4.8% |
| Zimbabweans | 99.9 /100 | #16 | Exceptional 4.8% |
| Immigrants | Bulgaria | 99.9 /100 | #17 | Exceptional 4.8% |
| Bolivians | 99.8 /100 | #18 | Exceptional 4.9% |
| Immigrants | Sudan | 99.8 /100 | #19 | Exceptional 4.9% |
| Immigrants | Taiwan | 99.8 /100 | #20 | Exceptional 4.9% |
| Ethiopians | 99.8 /100 | #21 | Exceptional 4.9% |
| Immigrants | South Central Asia | 99.8 /100 | #22 | Exceptional 4.9% |
| Hmong | 99.8 /100 | #23 | Exceptional 4.9% |
| Ugandans | 99.7 /100 | #24 | Exceptional 4.9% |
| Immigrants | Singapore | 99.5 /100 | #25 | Exceptional 5.0% |
| Immigrants | Kuwait | 99.5 /100 | #26 | Exceptional 5.0% |