Immigrants from Bulgaria vs Bhutanese Unemployment Among Ages 30 to 34 years

COMPARE

Immigrants from Bulgaria
Race
Ancestry
AfghanAfricanAlaska NativeAlaskan AthabascanAlbanianAleutAlsatianAmericanApacheArabArapahoArgentineanArmenianAssyrian/Chaldean/SyriacAustralianAustrianBahamianBangladeshiBarbadianBasqueBelgianBelizeanBermudanBlackfeetBolivianBrazilianBritishBritish West IndianBulgarianBurmeseCajunCambodianCanadianCape VerdeanCarpatho RusynCelticCentral AmericanCentral American IndianCherokeeCheyenneChickasawChileanChineseChippewaChoctawColombianColvilleComancheCosta RicanCreeCreekCroatianCrowCubanCypriotCzechCzechoslovakianDanishDelawareDominicanDutchDutch West IndianEastern EuropeanEcuadorianEgyptianEnglishEstonianEthiopianEuropeanFijianFilipinoFinnishFrenchFrench American IndianFrench CanadianGermanGerman RussianGhanaianGreekGuamanian/ChamorroGuatemalanGuyaneseHaitianHmongHonduranHopiHoumaHungarianIcelanderIndian (Asian)IndonesianInupiatIranianIraqiIrishIroquoisIsraeliItalianJamaicanJapaneseJordanianKenyanKiowaKoreanLaotianLatvianLebaneseLiberianLithuanianLumbeeLuxembourgerMacedonianMalaysianMalteseMarshalleseMenomineeMexicanMexican American IndianMongolianMoroccanNative HawaiianNavajoNepaleseNew ZealanderNicaraguanNigerianNorthern EuropeanNorwegianOkinawanOsageOttawaPaiutePakistaniPalestinianPanamanianParaguayanPennsylvania GermanPeruvianPimaPolishPortuguesePotawatomiPuebloPuerto RicanPuget Sound SalishRomanianRussianSalvadoranSamoanScandinavianScotch-IrishScottishSeminoleSenegaleseSerbianShoshoneSierra LeoneanSiouxSlavicSlovakSloveneSomaliSouth AfricanSouth AmericanSouth American IndianSoviet UnionSpaniardSpanishSpanish AmericanSpanish American IndianSri LankanSubsaharan AfricanSudaneseSwedishSwissSyrianTaiwaneseThaiTlingit-HaidaTohono O'OdhamTonganTrinidadian and TobagonianTsimshianTurkishU.S. Virgin IslanderUgandanUkrainianUruguayanUteVenezuelanVietnameseWelshWest IndianYakamaYaquiYugoslavianYumanYup'ikZimbabwean
Immigration
NonimmigrantsImmigrantsAfghanistanAfricaAlbaniaArgentinaArmeniaAsiaAustraliaAustriaBahamasBangladeshBarbadosBelarusBelgiumBelizeBoliviaBosnia and HerzegovinaBrazilBulgariaBurma/MyanmarCabo VerdeCambodiaCameroonCanadaCaribbeanCentral AmericaChileChinaColombiaCongoCosta RicaCroatiaCubaCzechoslovakiaDenmarkDominicaDominican RepublicEastern AfricaEastern AsiaEastern EuropeEcuadorEgyptEl SalvadorEnglandEritreaEthiopiaEuropeFijiFranceGermanyGhanaGreeceGrenadaGuatemalaGuyanaHaitiHondurasHong KongHungaryIndiaIndonesiaIranIraqIrelandIsraelItalyJamaicaJapanJordanKazakhstanKenyaKoreaKuwaitLaosLatin AmericaLatviaLebanonLiberiaLithuaniaMalaysiaMexicoMicronesiaMiddle AfricaMoldovaMoroccoNepalNetherlandsNicaraguaNigeriaNorth AmericaNorth MacedoniaNorthern AfricaNorthern EuropeNorwayOceaniaPakistanPanamaPeruPhilippinesPolandPortugalRomaniaRussiaSaudi ArabiaScotlandSenegalSerbiaSierra LeoneSingaporeSomaliaSouth AfricaSouth AmericaSouth Central AsiaSouth Eastern AsiaSouthern EuropeSpainSri LankaSt. Vincent and the GrenadinesSudanSwedenSwitzerlandSyriaTaiwanThailandTrinidad and TobagoTurkeyUgandaUkraineUruguayUzbekistanVenezuelaVietnamWest IndiesWestern AfricaWestern AsiaWestern EuropeYemenZaireZimbabweAzores
Bhutanese
Race
Ancestry
AfghanAfricanAlaska NativeAlaskan AthabascanAlbanianAleutAlsatianAmericanApacheArabArapahoArgentineanArmenianAssyrian/Chaldean/SyriacAustralianAustrianBahamianBangladeshiBarbadianBasqueBelgianBelizeanBermudanBhutaneseBlackfeetBolivianBrazilianBritishBritish West IndianBulgarianBurmeseCajunCambodianCanadianCape VerdeanCarpatho RusynCelticCentral AmericanCentral American IndianCherokeeCheyenneChickasawChileanChineseChippewaChoctawColombianColvilleComancheCosta RicanCreeCreekCroatianCrowCubanCypriotCzechCzechoslovakianDanishDelawareDominicanDutchDutch West IndianEastern EuropeanEcuadorianEgyptianEnglishEstonianEthiopianEuropeanFijianFilipinoFinnishFrenchFrench American IndianFrench CanadianGermanGerman RussianGhanaianGreekGuamanian/ChamorroGuatemalanGuyaneseHaitianHmongHonduranHopiHoumaHungarianIcelanderIndian (Asian)IndonesianInupiatIranianIraqiIrishIroquoisIsraeliItalianJamaicanJapaneseJordanianKenyanKiowaKoreanLaotianLatvianLebaneseLiberianLithuanianLumbeeLuxembourgerMacedonianMalaysianMalteseMarshalleseMenomineeMexicanMexican American IndianMongolianMoroccanNative HawaiianNavajoNepaleseNew ZealanderNicaraguanNigerianNorthern EuropeanNorwegianOkinawanOsageOttawaPaiutePakistaniPalestinianPanamanianParaguayanPennsylvania GermanPeruvianPimaPolishPortuguesePotawatomiPuebloPuerto RicanPuget Sound SalishRomanianRussianSalvadoranSamoanScandinavianScotch-IrishScottishSeminoleSenegaleseSerbianShoshoneSierra LeoneanSiouxSlavicSlovakSloveneSomaliSouth AfricanSouth AmericanSouth American IndianSoviet UnionSpaniardSpanishSpanish AmericanSpanish American IndianSri LankanSubsaharan AfricanSudaneseSwedishSwissSyrianTaiwaneseThaiTlingit-HaidaTohono O'OdhamTonganTrinidadian and TobagonianTsimshianTurkishU.S. Virgin IslanderUgandanUkrainianUruguayanUteVenezuelanVietnameseWelshWest IndianYakamaYaquiYugoslavianYumanYup'ikZimbabwean
Immigration
NonimmigrantsImmigrantsAfghanistanAfricaAlbaniaArgentinaArmeniaAsiaAustraliaAustriaBahamasBangladeshBarbadosBelarusBelgiumBelizeBoliviaBosnia and HerzegovinaBrazilBurma/MyanmarCabo VerdeCambodiaCameroonCanadaCaribbeanCentral AmericaChileChinaColombiaCongoCosta RicaCroatiaCubaCzechoslovakiaDenmarkDominicaDominican RepublicEastern AfricaEastern AsiaEastern EuropeEcuadorEgyptEl SalvadorEnglandEritreaEthiopiaEuropeFijiFranceGermanyGhanaGreeceGrenadaGuatemalaGuyanaHaitiHondurasHong KongHungaryIndiaIndonesiaIranIraqIrelandIsraelItalyJamaicaJapanJordanKazakhstanKenyaKoreaKuwaitLaosLatin AmericaLatviaLebanonLiberiaLithuaniaMalaysiaMexicoMicronesiaMiddle AfricaMoldovaMoroccoNepalNetherlandsNicaraguaNigeriaNorth AmericaNorth MacedoniaNorthern AfricaNorthern EuropeNorwayOceaniaPakistanPanamaPeruPhilippinesPolandPortugalRomaniaRussiaSaudi ArabiaScotlandSenegalSerbiaSierra LeoneSingaporeSomaliaSouth AfricaSouth AmericaSouth Central AsiaSouth Eastern AsiaSouthern EuropeSpainSri LankaSt. Vincent and the GrenadinesSudanSwedenSwitzerlandSyriaTaiwanThailandTrinidad and TobagoTurkeyUgandaUkraineUruguayUzbekistanVenezuelaVietnamWest IndiesWestern AfricaWestern AsiaWestern EuropeYemenZaireZimbabweAzores
Unemployment Among Ages 30 to 34 years
Income
Poverty
Unemployment
Labor Participation
Family Structure
Vehicle Availability
Education Level
Disability

Unemployment Among Ages 30 to 34 years Comparison

Immigrants from Bulgaria

Bhutanese

Exceptional
Exceptional
4.8%
UNEMPLOYMENT AMONG AGES 30 TO 34 YEARS
99.9/ 100
METRIC RATING
17th/ 347
METRIC RANK
5.2%
UNEMPLOYMENT AMONG AGES 30 TO 34 YEARS
93.5/ 100
METRIC RATING
87th/ 347
METRIC RANK

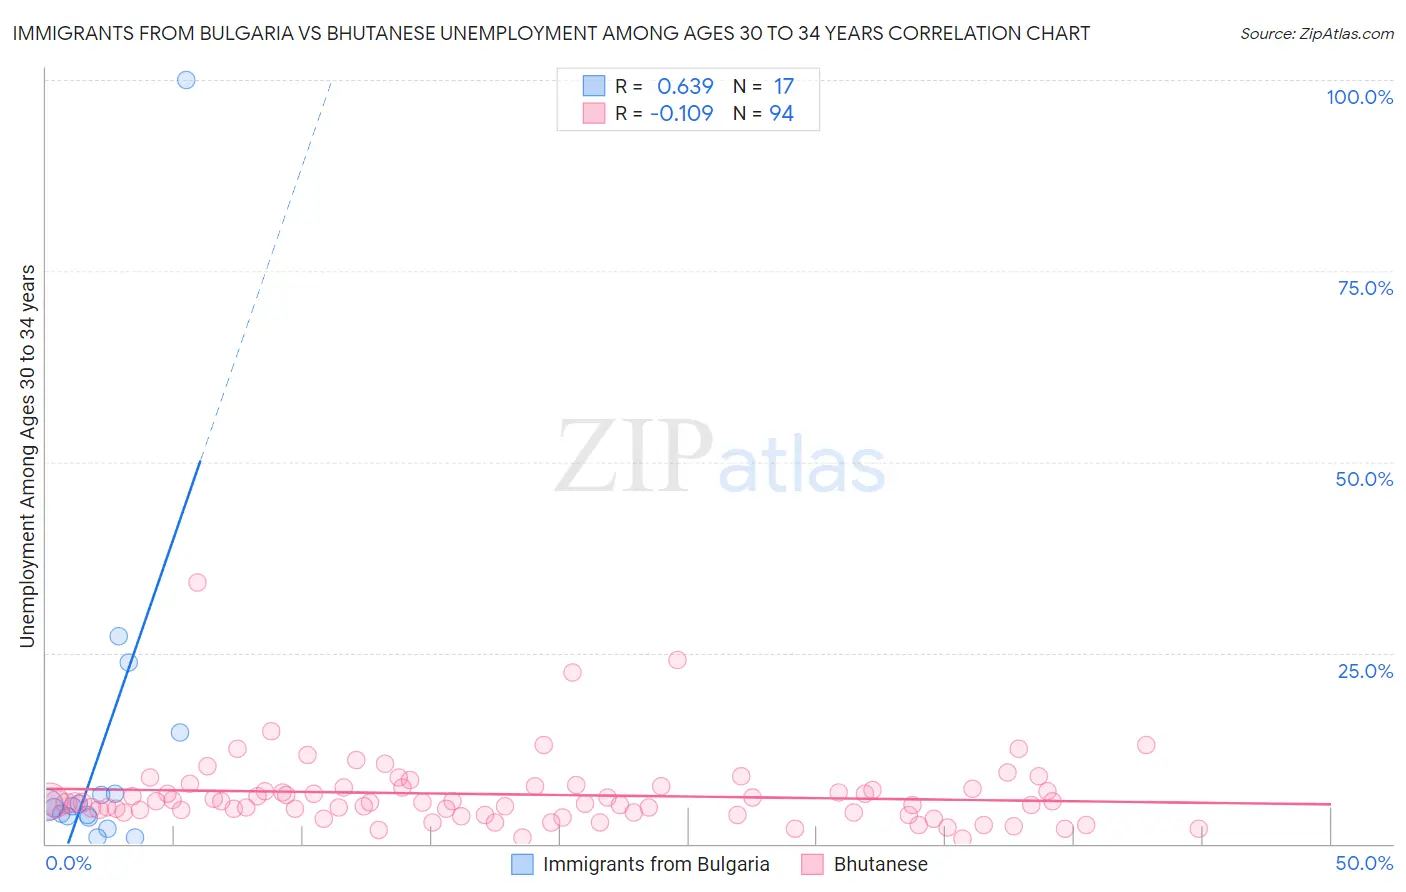
Immigrants from Bulgaria vs Bhutanese Unemployment Among Ages 30 to 34 years Correlation Chart

The statistical analysis conducted on geographies consisting of 168,277,056 people shows a significant positive correlation between the proportion of Immigrants from Bulgaria and unemployment rate among population between the ages 30 and 34 in the United States with a correlation coefficient (R) of 0.639 and weighted average of 4.8%. Similarly, the statistical analysis conducted on geographies consisting of 423,591,484 people shows a poor negative correlation between the proportion of Bhutanese and unemployment rate among population between the ages 30 and 34 in the United States with a correlation coefficient (R) of -0.109 and weighted average of 5.2%, a difference of 7.6%.
Immigrants from Bulgaria vs Bhutanese Unemployment Among Ages 30 to 34 years

Unemployment Among Ages 30 to 34 years Correlation Summary

MeasurementImmigrants from BulgariaBhutanese
Minimum0.80%0.60%
Maximum100.0%34.2%
Range99.2%33.6%
Mean12.8%6.5%
Median4.9%5.4%
Interquartile 25% (IQ1)3.5%4.1%
Interquartile 75% (IQ3)10.5%7.4%
Interquartile Range (IQR)7.1%3.3%
Standard Deviation (Sample)23.7%4.8%
Standard Deviation (Population)23.0%4.7%

Similar Demographics by Unemployment Among Ages 30 to 34 years

Demographics Similar to Immigrants from Bulgaria by Unemployment Among Ages 30 to 34 years

In terms of unemployment among ages 30 to 34 years, the demographic groups most similar to Immigrants from Bulgaria are Zimbabwean (4.8%, a difference of 0.11%), Okinawan (4.8%, a difference of 0.22%), Bolivian (4.9%, a difference of 0.40%), Immigrants from Sudan (4.9%, a difference of 0.46%), and Immigrants from Taiwan (4.9%, a difference of 0.48%).
DemographicsRating | RankUnemployment Among Ages 30 to 34 years
Tongans
99.9
/100
|
#10
Exceptional
4.8%
Immigrants | Bolivia
99.9
/100
|
#11
Exceptional
4.8%
Filipinos
99.9
/100
|
#12
Exceptional
4.8%
Cambodians
99.9
/100
|
#13
Exceptional
4.8%
Luxembourgers
99.9
/100
|
#14
Exceptional
4.8%
Okinawans
99.9
/100
|
#15
Exceptional
4.8%
Zimbabweans
99.9
/100
|
#16
Exceptional
4.8%
Immigrants | Bulgaria
99.9
/100
|
#17
Exceptional
4.8%
Bolivians
99.8
/100
|
#18
Exceptional
4.9%
Immigrants | Sudan
99.8
/100
|
#19
Exceptional
4.9%
Immigrants | Taiwan
99.8
/100
|
#20
Exceptional
4.9%
Ethiopians
99.8
/100
|
#21
Exceptional
4.9%
Immigrants | South Central Asia
99.8
/100
|
#22
Exceptional
4.9%
Hmong
99.8
/100
|
#23
Exceptional
4.9%
Ugandans
99.7
/100
|
#24
Exceptional
4.9%

Demographics Similar to Bhutanese by Unemployment Among Ages 30 to 34 years

In terms of unemployment among ages 30 to 34 years, the demographic groups most similar to Bhutanese are Immigrants from Australia (5.2%, a difference of 0.010%), Immigrants from Kenya (5.2%, a difference of 0.040%), Immigrants from Sweden (5.2%, a difference of 0.050%), Immigrants from Egypt (5.2%, a difference of 0.12%), and Immigrants from Uganda (5.2%, a difference of 0.15%).
DemographicsRating | RankUnemployment Among Ages 30 to 34 years
Immigrants | Indonesia
94.7
/100
|
#80
Exceptional
5.2%
Chileans
94.4
/100
|
#81
Exceptional
5.2%
Immigrants | Latvia
94.2
/100
|
#82
Exceptional
5.2%
Immigrants | Korea
94.1
/100
|
#83
Exceptional
5.2%
Immigrants | Uganda
94.0
/100
|
#84
Exceptional
5.2%
Immigrants | Egypt
93.9
/100
|
#85
Exceptional
5.2%
Immigrants | Australia
93.5
/100
|
#86
Exceptional
5.2%
Bhutanese
93.5
/100
|
#87
Exceptional
5.2%
Immigrants | Kenya
93.3
/100
|
#88
Exceptional
5.2%
Immigrants | Sweden
93.3
/100
|
#89
Exceptional
5.2%
Immigrants | Romania
92.8
/100
|
#90
Exceptional
5.2%
Iraqis
92.6
/100
|
#91
Exceptional
5.2%
Immigrants | Argentina
92.5
/100
|
#92
Exceptional
5.2%
Laotians
92.4
/100
|
#93
Exceptional
5.2%
Maltese
92.3
/100
|
#94
Exceptional
5.2%