Immigrants from Bulgaria vs Immigrants from West Indies Unemployment Among Women with Children Under 6 years
COMPARE
Immigrants from Bulgaria
Immigrants from West Indies
Unemployment Among Women with Children Under 6 years
Unemployment Among Women with Children Under 6 years Comparison
Immigrants from Bulgaria
Immigrants from West Indies
6.3%
UNEMPLOYMENT AMONG WOMEN WITH CHILDREN UNDER 6 YEARS
100.0/ 100
METRIC RATING
14th/ 347
METRIC RANK
9.0%
UNEMPLOYMENT AMONG WOMEN WITH CHILDREN UNDER 6 YEARS
0.0/ 100
METRIC RATING
303rd/ 347
METRIC RANK
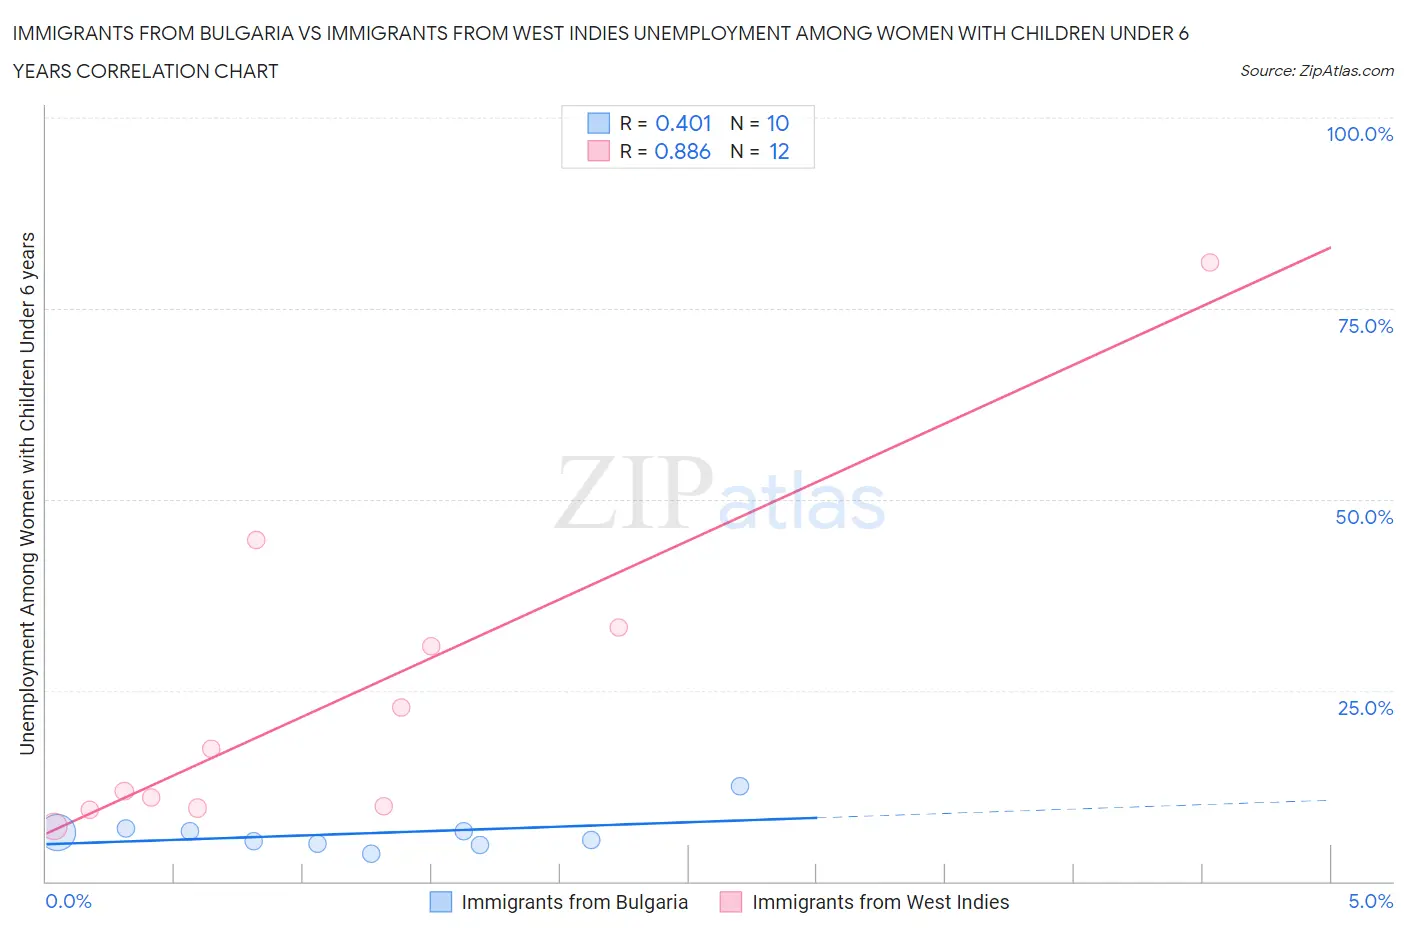
Immigrants from Bulgaria vs Immigrants from West Indies Unemployment Among Women with Children Under 6 years Correlation Chart
The statistical analysis conducted on geographies consisting of 147,587,845 people shows a moderate positive correlation between the proportion of Immigrants from Bulgaria and unemployment rate among women with children under the age of 6 in the United States with a correlation coefficient (R) of 0.401 and weighted average of 6.3%. Similarly, the statistical analysis conducted on geographies consisting of 68,002,118 people shows a very strong positive correlation between the proportion of Immigrants from West Indies and unemployment rate among women with children under the age of 6 in the United States with a correlation coefficient (R) of 0.886 and weighted average of 9.0%, a difference of 43.0%.
Unemployment Among Women with Children Under 6 years Correlation Summary
| Measurement | Immigrants from Bulgaria | Immigrants from West Indies |
| Minimum | 3.6% | 7.2% |
| Maximum | 12.4% | 81.0% |
| Range | 8.8% | 73.8% |
| Mean | 6.3% | 24.0% |
| Median | 5.9% | 14.6% |
| Interquartile 25% (IQ1) | 4.9% | 9.7% |
| Interquartile 75% (IQ3) | 6.5% | 32.0% |
| Interquartile Range (IQR) | 1.6% | 22.3% |
| Standard Deviation (Sample) | 2.4% | 21.5% |
| Standard Deviation (Population) | 2.3% | 20.6% |
Similar Demographics by Unemployment Among Women with Children Under 6 years
Demographics Similar to Immigrants from Bulgaria by Unemployment Among Women with Children Under 6 years
In terms of unemployment among women with children under 6 years, the demographic groups most similar to Immigrants from Bulgaria are Thai (6.3%, a difference of 0.10%), Immigrants from Eastern Asia (6.3%, a difference of 0.32%), Immigrants from Singapore (6.3%, a difference of 0.37%), Indian (Asian) (6.3%, a difference of 0.39%), and Immigrants from Uzbekistan (6.3%, a difference of 0.40%).
| Demographics | Rating | Rank | Unemployment Among Women with Children Under 6 years |
| Taiwanese | 100.0 /100 | #7 | Exceptional 6.1% |
| Immigrants | India | 100.0 /100 | #8 | Exceptional 6.1% |
| Filipinos | 100.0 /100 | #9 | Exceptional 6.1% |
| Immigrants | China | 100.0 /100 | #10 | Exceptional 6.2% |
| Indians (Asian) | 100.0 /100 | #11 | Exceptional 6.3% |
| Immigrants | Singapore | 100.0 /100 | #12 | Exceptional 6.3% |
| Immigrants | Eastern Asia | 100.0 /100 | #13 | Exceptional 6.3% |
| Immigrants | Bulgaria | 100.0 /100 | #14 | Exceptional 6.3% |
| Thais | 100.0 /100 | #15 | Exceptional 6.3% |
| Immigrants | Uzbekistan | 100.0 /100 | #16 | Exceptional 6.3% |
| Immigrants | Malaysia | 100.0 /100 | #17 | Exceptional 6.4% |
| Assyrians/Chaldeans/Syriacs | 100.0 /100 | #18 | Exceptional 6.5% |
| Mongolians | 100.0 /100 | #19 | Exceptional 6.5% |
| Ute | 100.0 /100 | #20 | Exceptional 6.5% |
| Burmese | 100.0 /100 | #21 | Exceptional 6.5% |
Demographics Similar to Immigrants from West Indies by Unemployment Among Women with Children Under 6 years
In terms of unemployment among women with children under 6 years, the demographic groups most similar to Immigrants from West Indies are Hispanic or Latino (9.0%, a difference of 0.030%), Immigrants from Mexico (9.1%, a difference of 0.14%), Alaskan Athabascan (9.1%, a difference of 0.55%), Pueblo (9.1%, a difference of 0.73%), and Dominican (9.1%, a difference of 0.85%).
| Demographics | Rating | Rank | Unemployment Among Women with Children Under 6 years |
| Immigrants | Dominican Republic | 0.0 /100 | #296 | Tragic 8.9% |
| Mexicans | 0.0 /100 | #297 | Tragic 8.9% |
| Tlingit-Haida | 0.0 /100 | #298 | Tragic 8.9% |
| Immigrants | Jamaica | 0.0 /100 | #299 | Tragic 8.9% |
| Creek | 0.0 /100 | #300 | Tragic 8.9% |
| Chickasaw | 0.0 /100 | #301 | Tragic 9.0% |
| Hispanics or Latinos | 0.0 /100 | #302 | Tragic 9.0% |
| Immigrants | West Indies | 0.0 /100 | #303 | Tragic 9.0% |
| Immigrants | Mexico | 0.0 /100 | #304 | Tragic 9.1% |
| Alaskan Athabascans | 0.0 /100 | #305 | Tragic 9.1% |
| Pueblo | 0.0 /100 | #306 | Tragic 9.1% |
| Dominicans | 0.0 /100 | #307 | Tragic 9.1% |
| Immigrants | Micronesia | 0.0 /100 | #308 | Tragic 9.1% |
| Africans | 0.0 /100 | #309 | Tragic 9.2% |
| Cajuns | 0.0 /100 | #310 | Tragic 9.2% |