Immigrants from Belgium vs Immigrants from Israel Male Unemployment

COMPARE

Immigrants from Belgium
Race
Ancestry
AfghanAfricanAlaska NativeAlaskan AthabascanAlbanianAleutAlsatianAmericanApacheArabArapahoArgentineanArmenianAssyrian/Chaldean/SyriacAustralianAustrianBahamianBangladeshiBarbadianBasqueBelgianBelizeanBermudanBhutaneseBlackfeetBolivianBrazilianBritishBritish West IndianBulgarianBurmeseCajunCambodianCanadianCape VerdeanCarpatho RusynCelticCentral AmericanCentral American IndianCherokeeCheyenneChickasawChileanChineseChippewaChoctawColombianColvilleComancheCosta RicanCreeCreekCroatianCrowCubanCypriotCzechCzechoslovakianDanishDelawareDominicanDutchDutch West IndianEastern EuropeanEcuadorianEgyptianEnglishEstonianEthiopianEuropeanFijianFilipinoFinnishFrenchFrench American IndianFrench CanadianGermanGerman RussianGhanaianGreekGuamanian/ChamorroGuatemalanGuyaneseHaitianHmongHonduranHopiHoumaHungarianIcelanderIndian (Asian)IndonesianInupiatIranianIraqiIrishIroquoisIsraeliItalianJamaicanJapaneseJordanianKenyanKiowaKoreanLaotianLatvianLebaneseLiberianLithuanianLumbeeLuxembourgerMacedonianMalaysianMalteseMarshalleseMenomineeMexicanMexican American IndianMongolianMoroccanNative HawaiianNavajoNepaleseNew ZealanderNicaraguanNigerianNorthern EuropeanNorwegianOkinawanOsageOttawaPaiutePakistaniPalestinianPanamanianParaguayanPennsylvania GermanPeruvianPimaPolishPortuguesePotawatomiPuebloPuerto RicanPuget Sound SalishRomanianRussianSalvadoranSamoanScandinavianScotch-IrishScottishSeminoleSenegaleseSerbianShoshoneSierra LeoneanSiouxSlavicSlovakSloveneSomaliSouth AfricanSouth AmericanSouth American IndianSoviet UnionSpaniardSpanishSpanish AmericanSpanish American IndianSri LankanSubsaharan AfricanSudaneseSwedishSwissSyrianTaiwaneseThaiTlingit-HaidaTohono O'OdhamTonganTrinidadian and TobagonianTsimshianTurkishU.S. Virgin IslanderUgandanUkrainianUruguayanUteVenezuelanVietnameseWelshWest IndianYakamaYaquiYugoslavianYumanYup'ikZimbabwean
Immigration
NonimmigrantsImmigrantsAfghanistanAfricaAlbaniaArgentinaArmeniaAsiaAustraliaAustriaBahamasBangladeshBarbadosBelarusBelgiumBelizeBoliviaBosnia and HerzegovinaBrazilBulgariaBurma/MyanmarCabo VerdeCambodiaCameroonCanadaCaribbeanCentral AmericaChileChinaColombiaCongoCosta RicaCroatiaCubaCzechoslovakiaDenmarkDominicaDominican RepublicEastern AfricaEastern AsiaEastern EuropeEcuadorEgyptEl SalvadorEnglandEritreaEthiopiaEuropeFijiFranceGermanyGhanaGreeceGrenadaGuatemalaGuyanaHaitiHondurasHong KongHungaryIndiaIndonesiaIranIraqIrelandItalyJamaicaJapanJordanKazakhstanKenyaKoreaKuwaitLaosLatin AmericaLatviaLebanonLiberiaLithuaniaMalaysiaMexicoMicronesiaMiddle AfricaMoldovaMoroccoNepalNetherlandsNicaraguaNigeriaNorth AmericaNorth MacedoniaNorthern AfricaNorthern EuropeNorwayOceaniaPakistanPanamaPeruPhilippinesPolandPortugalRomaniaRussiaSaudi ArabiaScotlandSenegalSerbiaSierra LeoneSingaporeSomaliaSouth AfricaSouth AmericaSouth Central AsiaSouth Eastern AsiaSouthern EuropeSpainSri LankaSt. Vincent and the GrenadinesSudanSwedenSwitzerlandSyriaTaiwanThailandTrinidad and TobagoTurkeyUgandaUkraineUruguayUzbekistanVenezuelaVietnamWest IndiesWestern AfricaWestern AsiaWestern EuropeYemenZaireZimbabweAzores
Immigrants from Israel
Race
Ancestry
AfghanAfricanAlaska NativeAlaskan AthabascanAlbanianAleutAlsatianAmericanApacheArabArapahoArgentineanArmenianAssyrian/Chaldean/SyriacAustralianAustrianBahamianBangladeshiBarbadianBasqueBelgianBelizeanBermudanBhutaneseBlackfeetBolivianBrazilianBritishBritish West IndianBulgarianBurmeseCajunCambodianCanadianCape VerdeanCarpatho RusynCelticCentral AmericanCentral American IndianCherokeeCheyenneChickasawChileanChineseChippewaChoctawColombianColvilleComancheCosta RicanCreeCreekCroatianCrowCubanCypriotCzechCzechoslovakianDanishDelawareDominicanDutchDutch West IndianEastern EuropeanEcuadorianEgyptianEnglishEstonianEthiopianEuropeanFijianFilipinoFinnishFrenchFrench American IndianFrench CanadianGermanGerman RussianGhanaianGreekGuamanian/ChamorroGuatemalanGuyaneseHaitianHmongHonduranHopiHoumaHungarianIcelanderIndian (Asian)IndonesianInupiatIranianIraqiIrishIroquoisIsraeliItalianJamaicanJapaneseJordanianKenyanKiowaKoreanLaotianLatvianLebaneseLiberianLithuanianLumbeeLuxembourgerMacedonianMalaysianMalteseMarshalleseMenomineeMexicanMexican American IndianMongolianMoroccanNative HawaiianNavajoNepaleseNew ZealanderNicaraguanNigerianNorthern EuropeanNorwegianOkinawanOsageOttawaPaiutePakistaniPalestinianPanamanianParaguayanPennsylvania GermanPeruvianPimaPolishPortuguesePotawatomiPuebloPuerto RicanPuget Sound SalishRomanianRussianSalvadoranSamoanScandinavianScotch-IrishScottishSeminoleSenegaleseSerbianShoshoneSierra LeoneanSiouxSlavicSlovakSloveneSomaliSouth AfricanSouth AmericanSouth American IndianSoviet UnionSpaniardSpanishSpanish AmericanSpanish American IndianSri LankanSubsaharan AfricanSudaneseSwedishSwissSyrianTaiwaneseThaiTlingit-HaidaTohono O'OdhamTonganTrinidadian and TobagonianTsimshianTurkishU.S. Virgin IslanderUgandanUkrainianUruguayanUteVenezuelanVietnameseWelshWest IndianYakamaYaquiYugoslavianYumanYup'ikZimbabwean
Immigration
NonimmigrantsImmigrantsAfghanistanAfricaAlbaniaArgentinaArmeniaAsiaAustraliaAustriaBahamasBangladeshBarbadosBelarusBelizeBoliviaBosnia and HerzegovinaBrazilBulgariaBurma/MyanmarCabo VerdeCambodiaCameroonCanadaCaribbeanCentral AmericaChileChinaColombiaCongoCosta RicaCroatiaCubaCzechoslovakiaDenmarkDominicaDominican RepublicEastern AfricaEastern AsiaEastern EuropeEcuadorEgyptEl SalvadorEnglandEritreaEthiopiaEuropeFijiFranceGermanyGhanaGreeceGrenadaGuatemalaGuyanaHaitiHondurasHong KongHungaryIndiaIndonesiaIranIraqIrelandIsraelItalyJamaicaJapanJordanKazakhstanKenyaKoreaKuwaitLaosLatin AmericaLatviaLebanonLiberiaLithuaniaMalaysiaMexicoMicronesiaMiddle AfricaMoldovaMoroccoNepalNetherlandsNicaraguaNigeriaNorth AmericaNorth MacedoniaNorthern AfricaNorthern EuropeNorwayOceaniaPakistanPanamaPeruPhilippinesPolandPortugalRomaniaRussiaSaudi ArabiaScotlandSenegalSerbiaSierra LeoneSingaporeSomaliaSouth AfricaSouth AmericaSouth Central AsiaSouth Eastern AsiaSouthern EuropeSpainSri LankaSt. Vincent and the GrenadinesSudanSwedenSwitzerlandSyriaTaiwanThailandTrinidad and TobagoTurkeyUgandaUkraineUruguayUzbekistanVenezuelaVietnamWest IndiesWestern AfricaWestern AsiaWestern EuropeYemenZaireZimbabweAzores
Male Unemployment
Income
Poverty
Unemployment
Labor Participation
Family Structure
Vehicle Availability
Education Level
Disability

Male Unemployment Comparison

Immigrants from Belgium

Immigrants from Israel

Exceptional
Fair
4.9%
MALE UNEMPLOYMENT
99.2/ 100
METRIC RATING
42nd/ 347
METRIC RANK
5.4%
MALE UNEMPLOYMENT
25.2/ 100
METRIC RATING
193rd/ 347
METRIC RANK

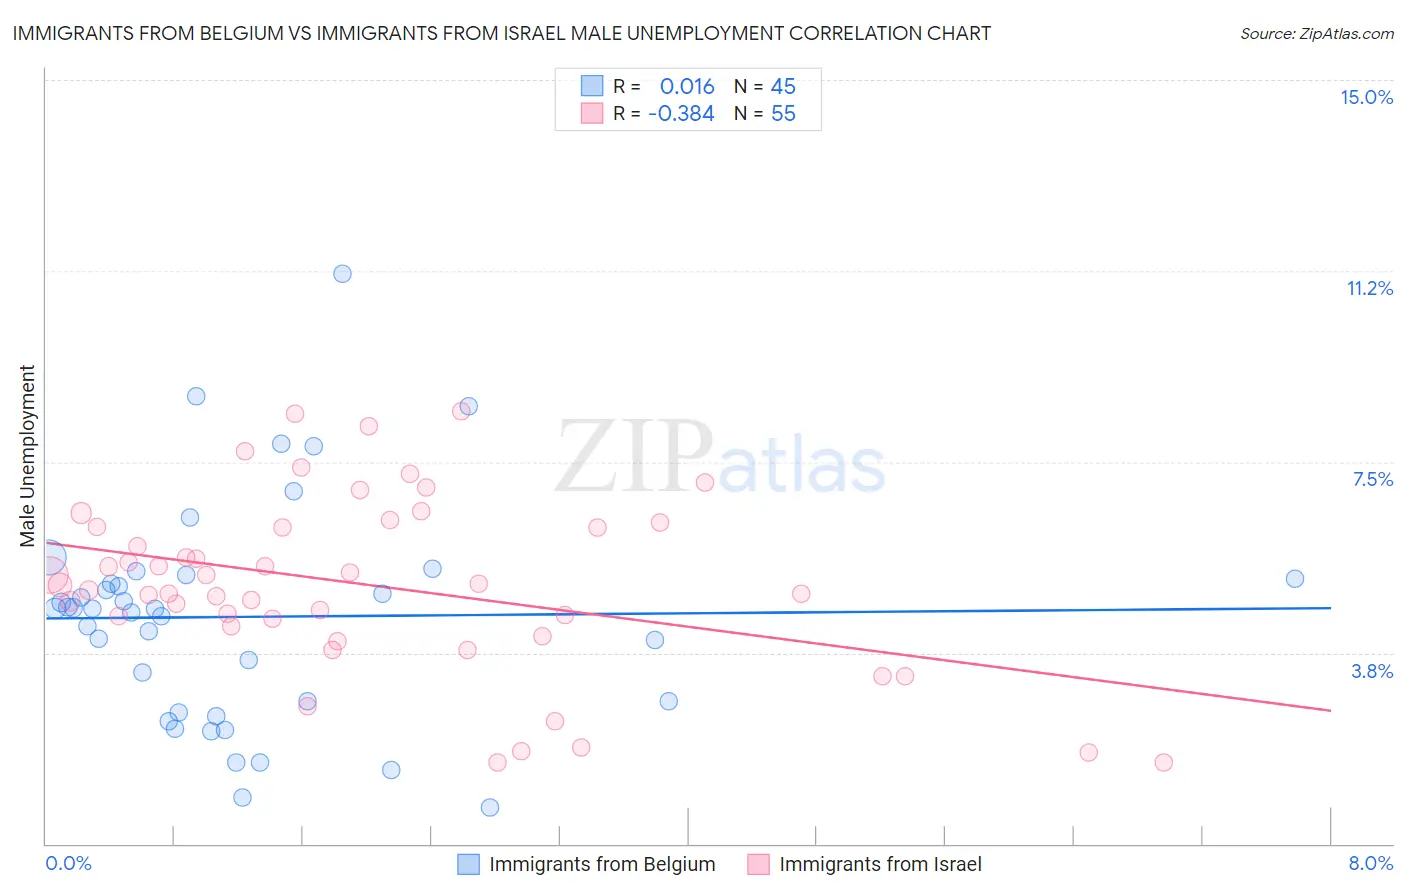
Immigrants from Belgium vs Immigrants from Israel Male Unemployment Correlation Chart

The statistical analysis conducted on geographies consisting of 146,559,932 people shows no correlation between the proportion of Immigrants from Belgium and unemployment rate among males in the United States with a correlation coefficient (R) of 0.016 and weighted average of 4.9%. Similarly, the statistical analysis conducted on geographies consisting of 209,695,257 people shows a mild negative correlation between the proportion of Immigrants from Israel and unemployment rate among males in the United States with a correlation coefficient (R) of -0.384 and weighted average of 5.4%, a difference of 9.4%.
Immigrants from Belgium vs Immigrants from Israel Male Unemployment

Male Unemployment Correlation Summary

MeasurementImmigrants from BelgiumImmigrants from Israel
Minimum0.70%1.6%
Maximum11.2%8.5%
Range10.5%6.9%
Mean4.5%5.1%
Median4.6%5.1%
Interquartile 25% (IQ1)2.7%4.3%
Interquartile 75% (IQ3)5.2%6.2%
Interquartile Range (IQR)2.5%2.0%
Standard Deviation (Sample)2.2%1.7%
Standard Deviation (Population)2.1%1.7%

Similar Demographics by Male Unemployment

Demographics Similar to Immigrants from Belgium by Male Unemployment

In terms of male unemployment, the demographic groups most similar to Immigrants from Belgium are Chinese (4.9%, a difference of 0.020%), Northern European (4.9%, a difference of 0.10%), Immigrants from Japan (4.9%, a difference of 0.10%), Burmese (4.9%, a difference of 0.19%), and Immigrants from Bosnia and Herzegovina (4.9%, a difference of 0.26%).
DemographicsRating | RankMale Unemployment
Paraguayans
99.5
/100
|
#35
Exceptional
4.9%
Immigrants | Singapore
99.4
/100
|
#36
Exceptional
4.9%
Scotch-Irish
99.4
/100
|
#37
Exceptional
4.9%
Immigrants | Bosnia and Herzegovina
99.4
/100
|
#38
Exceptional
4.9%
Burmese
99.3
/100
|
#39
Exceptional
4.9%
Northern Europeans
99.3
/100
|
#40
Exceptional
4.9%
Chinese
99.3
/100
|
#41
Exceptional
4.9%
Immigrants | Belgium
99.2
/100
|
#42
Exceptional
4.9%
Immigrants | Japan
99.2
/100
|
#43
Exceptional
4.9%
Immigrants | Korea
99.1
/100
|
#44
Exceptional
4.9%
Immigrants | Zimbabwe
99.0
/100
|
#45
Exceptional
4.9%
Bhutanese
98.9
/100
|
#46
Exceptional
4.9%
Austrians
98.9
/100
|
#47
Exceptional
4.9%
Immigrants | Scotland
98.9
/100
|
#48
Exceptional
4.9%
Poles
98.9
/100
|
#49
Exceptional
4.9%

Demographics Similar to Immigrants from Israel by Male Unemployment

In terms of male unemployment, the demographic groups most similar to Immigrants from Israel are Immigrants from Belarus (5.4%, a difference of 0.060%), Immigrants from South Eastern Asia (5.4%, a difference of 0.22%), Immigrants from Uganda (5.4%, a difference of 0.26%), Immigrants from South America (5.4%, a difference of 0.30%), and Arab (5.4%, a difference of 0.36%).
DemographicsRating | RankMale Unemployment
Iraqis
31.6
/100
|
#186
Fair
5.4%
Costa Ricans
31.3
/100
|
#187
Fair
5.4%
Arabs
30.2
/100
|
#188
Fair
5.4%
Immigrants | South America
29.4
/100
|
#189
Fair
5.4%
Immigrants | Uganda
28.8
/100
|
#190
Fair
5.4%
Immigrants | South Eastern Asia
28.2
/100
|
#191
Fair
5.4%
Immigrants | Belarus
26.0
/100
|
#192
Fair
5.4%
Immigrants | Israel
25.2
/100
|
#193
Fair
5.4%
Spanish
19.7
/100
|
#194
Poor
5.4%
Immigrants | Southern Europe
17.7
/100
|
#195
Poor
5.4%
Albanians
17.3
/100
|
#196
Poor
5.4%
Alsatians
16.7
/100
|
#197
Poor
5.4%
Immigrants | Thailand
14.7
/100
|
#198
Poor
5.4%
Immigrants | Greece
14.5
/100
|
#199
Poor
5.4%
Immigrants | Zaire
13.7
/100
|
#200
Poor
5.4%