Immigrants from the Azores vs Laotian Female Unemployment
COMPARE
Immigrants from the Azores
Laotian
Female Unemployment
Female Unemployment Comparison
Immigrants from the Azores
Laotians
5.8%
FEMALE UNEMPLOYMENT
0.1/ 100
METRIC RATING
263rd/ 347
METRIC RANK
5.3%
FEMALE UNEMPLOYMENT
45.1/ 100
METRIC RATING
179th/ 347
METRIC RANK
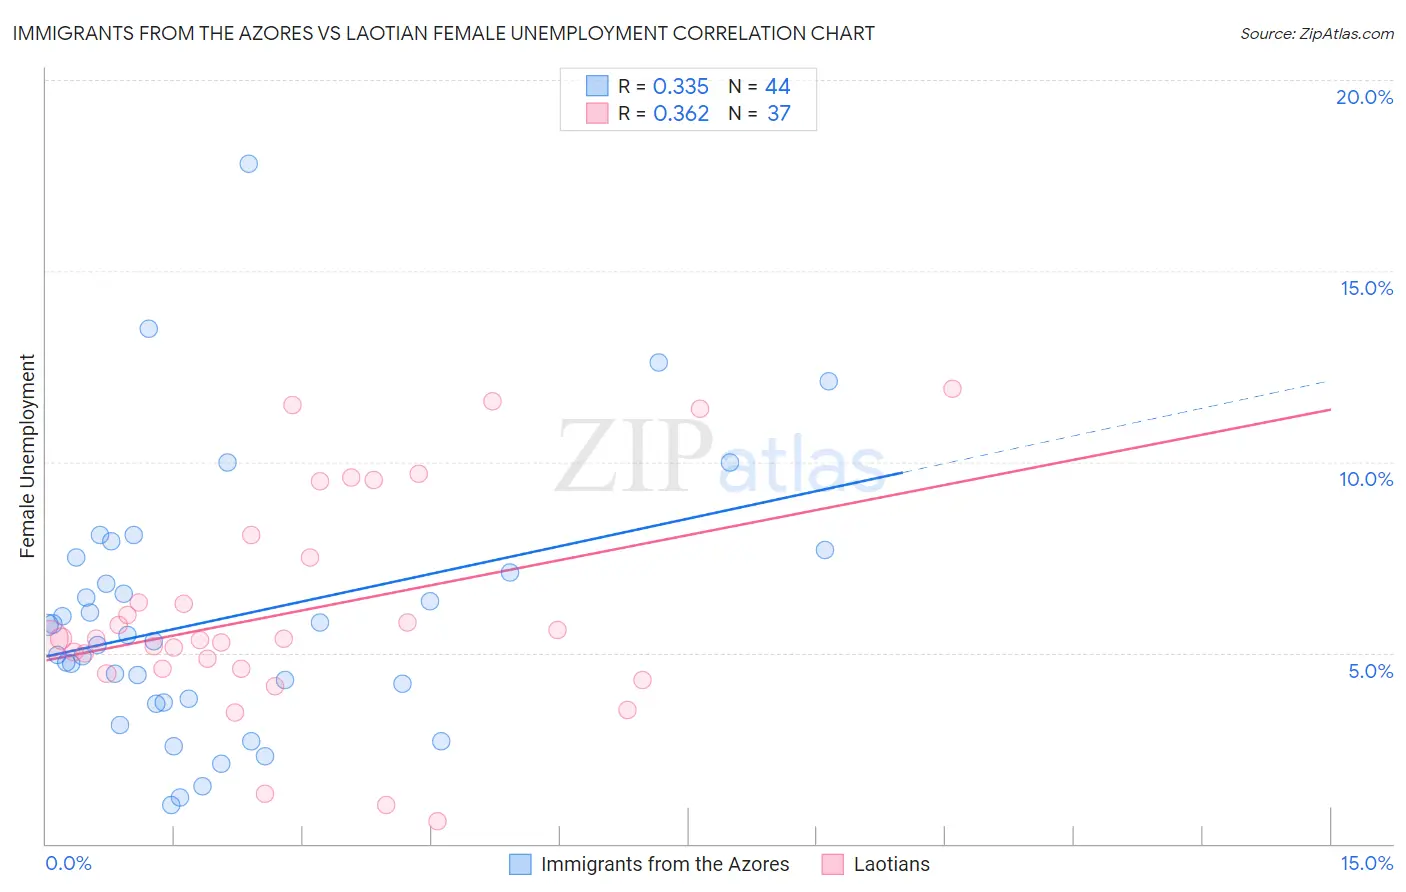
Immigrants from the Azores vs Laotian Female Unemployment Correlation Chart
The statistical analysis conducted on geographies consisting of 46,148,620 people shows a mild positive correlation between the proportion of Immigrants from the Azores and unemploymnet rate among females in the United States with a correlation coefficient (R) of 0.335 and weighted average of 5.8%. Similarly, the statistical analysis conducted on geographies consisting of 224,555,281 people shows a mild positive correlation between the proportion of Laotians and unemploymnet rate among females in the United States with a correlation coefficient (R) of 0.362 and weighted average of 5.3%, a difference of 10.3%.
Female Unemployment Correlation Summary
| Measurement | Immigrants from the Azores | Laotian |
| Minimum | 1.0% | 0.60% |
| Maximum | 17.8% | 11.9% |
| Range | 16.8% | 11.3% |
| Mean | 5.9% | 6.1% |
| Median | 5.4% | 5.4% |
| Interquartile 25% (IQ1) | 3.7% | 4.6% |
| Interquartile 75% (IQ3) | 7.3% | 7.8% |
| Interquartile Range (IQR) | 3.6% | 3.2% |
| Standard Deviation (Sample) | 3.4% | 2.9% |
| Standard Deviation (Population) | 3.4% | 2.8% |
Similar Demographics by Female Unemployment
Demographics Similar to Immigrants from the Azores by Female Unemployment
In terms of female unemployment, the demographic groups most similar to Immigrants from the Azores are Immigrants from Bahamas (5.8%, a difference of 0.39%), Immigrants from Nigeria (5.8%, a difference of 0.67%), Kiowa (5.8%, a difference of 0.71%), Blackfeet (5.9%, a difference of 0.79%), and Nigerian (5.8%, a difference of 0.97%).
| Demographics | Rating | Rank | Female Unemployment |
| Sub-Saharan Africans | 0.4 /100 | #256 | Tragic 5.7% |
| Dutch West Indians | 0.3 /100 | #257 | Tragic 5.7% |
| Immigrants | Portugal | 0.2 /100 | #258 | Tragic 5.8% |
| Immigrants | Fiji | 0.2 /100 | #259 | Tragic 5.8% |
| Nigerians | 0.2 /100 | #260 | Tragic 5.8% |
| Kiowa | 0.1 /100 | #261 | Tragic 5.8% |
| Immigrants | Nigeria | 0.1 /100 | #262 | Tragic 5.8% |
| Immigrants | Azores | 0.1 /100 | #263 | Tragic 5.8% |
| Immigrants | Bahamas | 0.1 /100 | #264 | Tragic 5.8% |
| Blackfeet | 0.0 /100 | #265 | Tragic 5.9% |
| Cape Verdeans | 0.0 /100 | #266 | Tragic 5.9% |
| Nepalese | 0.0 /100 | #267 | Tragic 5.9% |
| Hondurans | 0.0 /100 | #268 | Tragic 5.9% |
| Immigrants | Western Africa | 0.0 /100 | #269 | Tragic 5.9% |
| Immigrants | Honduras | 0.0 /100 | #270 | Tragic 5.9% |
Demographics Similar to Laotians by Female Unemployment
In terms of female unemployment, the demographic groups most similar to Laotians are Immigrants from Southern Europe (5.3%, a difference of 0.070%), Immigrants from Congo (5.3%, a difference of 0.12%), Immigrants from Vietnam (5.3%, a difference of 0.14%), Immigrants from Morocco (5.3%, a difference of 0.14%), and Taiwanese (5.3%, a difference of 0.14%).
| Demographics | Rating | Rank | Female Unemployment |
| Immigrants | Uganda | 50.7 /100 | #172 | Average 5.3% |
| Iranians | 50.4 /100 | #173 | Average 5.3% |
| Immigrants | Poland | 50.0 /100 | #174 | Average 5.3% |
| Immigrants | Laos | 47.5 /100 | #175 | Average 5.3% |
| Immigrants | Vietnam | 47.5 /100 | #176 | Average 5.3% |
| Immigrants | Morocco | 47.4 /100 | #177 | Average 5.3% |
| Immigrants | Southern Europe | 46.2 /100 | #178 | Average 5.3% |
| Laotians | 45.1 /100 | #179 | Average 5.3% |
| Immigrants | Congo | 43.1 /100 | #180 | Average 5.3% |
| Taiwanese | 42.7 /100 | #181 | Average 5.3% |
| Immigrants | Nonimmigrants | 42.6 /100 | #182 | Average 5.3% |
| Immigrants | Indonesia | 40.7 /100 | #183 | Average 5.3% |
| Immigrants | Ukraine | 40.1 /100 | #184 | Average 5.3% |
| Malaysians | 40.1 /100 | #185 | Average 5.3% |
| Immigrants | Belarus | 39.4 /100 | #186 | Fair 5.3% |