Immigrants from Australia vs Costa Rican Unemployment

COMPARE

Immigrants from Australia
Race
Ancestry
AfghanAfricanAlaska NativeAlaskan AthabascanAlbanianAleutAlsatianAmericanApacheArabArapahoArgentineanArmenianAssyrian/Chaldean/SyriacAustralianAustrianBahamianBangladeshiBarbadianBasqueBelgianBelizeanBermudanBhutaneseBlackfeetBolivianBrazilianBritishBritish West IndianBulgarianBurmeseCajunCambodianCanadianCape VerdeanCarpatho RusynCelticCentral AmericanCentral American IndianCherokeeCheyenneChickasawChileanChineseChippewaChoctawColombianColvilleComancheCreeCreekCroatianCrowCubanCypriotCzechCzechoslovakianDanishDelawareDominicanDutchDutch West IndianEastern EuropeanEcuadorianEgyptianEnglishEstonianEthiopianEuropeanFijianFilipinoFinnishFrenchFrench American IndianFrench CanadianGermanGerman RussianGhanaianGreekGuamanian/ChamorroGuatemalanGuyaneseHaitianHmongHonduranHopiHoumaHungarianIcelanderIndian (Asian)IndonesianInupiatIranianIraqiIrishIroquoisIsraeliItalianJamaicanJapaneseJordanianKenyanKiowaKoreanLaotianLatvianLebaneseLiberianLithuanianLumbeeLuxembourgerMacedonianMalaysianMalteseMarshalleseMenomineeMexicanMexican American IndianMongolianMoroccanNative HawaiianNavajoNepaleseNew ZealanderNicaraguanNigerianNorthern EuropeanNorwegianOkinawanOsageOttawaPaiutePakistaniPalestinianPanamanianParaguayanPennsylvania GermanPeruvianPimaPolishPortuguesePotawatomiPuebloPuerto RicanPuget Sound SalishRomanianRussianSalvadoranSamoanScandinavianScotch-IrishScottishSeminoleSenegaleseSerbianShoshoneSierra LeoneanSiouxSlavicSlovakSloveneSomaliSouth AfricanSouth AmericanSouth American IndianSoviet UnionSpaniardSpanishSpanish AmericanSpanish American IndianSri LankanSubsaharan AfricanSudaneseSwedishSwissSyrianTaiwaneseThaiTlingit-HaidaTohono O'OdhamTonganTrinidadian and TobagonianTsimshianTurkishU.S. Virgin IslanderUgandanUkrainianUruguayanUteVenezuelanVietnameseWelshWest IndianYakamaYaquiYugoslavianYumanYup'ikZimbabwean
Immigration
NonimmigrantsImmigrantsAfghanistanAfricaAlbaniaArgentinaArmeniaAsiaAustraliaAustriaBahamasBangladeshBarbadosBelarusBelgiumBelizeBoliviaBosnia and HerzegovinaBrazilBulgariaBurma/MyanmarCabo VerdeCambodiaCameroonCanadaCaribbeanCentral AmericaChileChinaColombiaCongoCosta RicaCroatiaCubaCzechoslovakiaDenmarkDominicaDominican RepublicEastern AfricaEastern AsiaEastern EuropeEcuadorEgyptEl SalvadorEnglandEritreaEthiopiaEuropeFijiFranceGermanyGhanaGreeceGrenadaGuatemalaGuyanaHaitiHondurasHong KongHungaryIndiaIndonesiaIranIraqIrelandIsraelItalyJamaicaJapanJordanKazakhstanKenyaKoreaKuwaitLaosLatin AmericaLatviaLebanonLiberiaLithuaniaMalaysiaMexicoMicronesiaMiddle AfricaMoldovaMoroccoNepalNetherlandsNicaraguaNigeriaNorth AmericaNorth MacedoniaNorthern AfricaNorthern EuropeNorwayOceaniaPakistanPanamaPeruPhilippinesPolandPortugalRomaniaRussiaSaudi ArabiaScotlandSenegalSerbiaSierra LeoneSingaporeSomaliaSouth AfricaSouth AmericaSouth Central AsiaSouth Eastern AsiaSouthern EuropeSpainSri LankaSt. Vincent and the GrenadinesSudanSwedenSwitzerlandSyriaTaiwanThailandTrinidad and TobagoTurkeyUgandaUkraineUruguayUzbekistanVenezuelaVietnamWest IndiesWestern AfricaWestern AsiaWestern EuropeYemenZaireZimbabweAzores
Costa Rican
Race
Ancestry
AfghanAfricanAlaska NativeAlaskan AthabascanAlbanianAleutAlsatianAmericanApacheArabArapahoArgentineanArmenianAssyrian/Chaldean/SyriacAustralianAustrianBahamianBangladeshiBarbadianBasqueBelgianBelizeanBermudanBhutaneseBlackfeetBolivianBrazilianBritishBritish West IndianBulgarianBurmeseCajunCambodianCanadianCape VerdeanCarpatho RusynCelticCentral AmericanCentral American IndianCherokeeCheyenneChickasawChileanChineseChippewaChoctawColombianColvilleComancheCosta RicanCreeCreekCroatianCrowCubanCypriotCzechCzechoslovakianDanishDelawareDominicanDutchDutch West IndianEastern EuropeanEcuadorianEgyptianEnglishEstonianEthiopianEuropeanFijianFilipinoFinnishFrenchFrench American IndianFrench CanadianGermanGerman RussianGhanaianGreekGuamanian/ChamorroGuatemalanGuyaneseHaitianHmongHonduranHopiHoumaHungarianIcelanderIndian (Asian)IndonesianInupiatIranianIraqiIrishIroquoisIsraeliItalianJamaicanJapaneseJordanianKenyanKiowaKoreanLaotianLatvianLebaneseLiberianLithuanianLumbeeLuxembourgerMacedonianMalaysianMalteseMarshalleseMenomineeMexicanMexican American IndianMongolianMoroccanNative HawaiianNavajoNepaleseNew ZealanderNicaraguanNigerianNorthern EuropeanNorwegianOkinawanOsageOttawaPaiutePakistaniPalestinianPanamanianParaguayanPennsylvania GermanPeruvianPimaPolishPortuguesePotawatomiPuebloPuerto RicanPuget Sound SalishRomanianRussianSalvadoranSamoanScandinavianScotch-IrishScottishSeminoleSenegaleseSerbianShoshoneSierra LeoneanSiouxSlavicSlovakSloveneSomaliSouth AfricanSouth AmericanSouth American IndianSoviet UnionSpaniardSpanishSpanish AmericanSpanish American IndianSri LankanSubsaharan AfricanSudaneseSwedishSwissSyrianTaiwaneseThaiTlingit-HaidaTohono O'OdhamTonganTrinidadian and TobagonianTsimshianTurkishU.S. Virgin IslanderUgandanUkrainianUruguayanUteVenezuelanVietnameseWelshWest IndianYakamaYaquiYugoslavianYumanYup'ikZimbabwean
Immigration
NonimmigrantsImmigrantsAfghanistanAfricaAlbaniaArgentinaArmeniaAsiaAustriaBahamasBangladeshBarbadosBelarusBelgiumBelizeBoliviaBosnia and HerzegovinaBrazilBulgariaBurma/MyanmarCabo VerdeCambodiaCameroonCanadaCaribbeanCentral AmericaChileChinaColombiaCongoCosta RicaCroatiaCubaCzechoslovakiaDenmarkDominicaDominican RepublicEastern AfricaEastern AsiaEastern EuropeEcuadorEgyptEl SalvadorEnglandEritreaEthiopiaEuropeFijiFranceGermanyGhanaGreeceGrenadaGuatemalaGuyanaHaitiHondurasHong KongHungaryIndiaIndonesiaIranIraqIrelandIsraelItalyJamaicaJapanJordanKazakhstanKenyaKoreaKuwaitLaosLatin AmericaLatviaLebanonLiberiaLithuaniaMalaysiaMexicoMicronesiaMiddle AfricaMoldovaMoroccoNepalNetherlandsNicaraguaNigeriaNorth AmericaNorth MacedoniaNorthern AfricaNorthern EuropeNorwayOceaniaPakistanPanamaPeruPhilippinesPolandPortugalRomaniaRussiaSaudi ArabiaScotlandSenegalSerbiaSierra LeoneSingaporeSomaliaSouth AfricaSouth AmericaSouth Central AsiaSouth Eastern AsiaSouthern EuropeSpainSri LankaSt. Vincent and the GrenadinesSudanSwedenSwitzerlandSyriaTaiwanThailandTrinidad and TobagoTurkeyUgandaUkraineUruguayUzbekistanVenezuelaVietnamWest IndiesWestern AfricaWestern AsiaWestern EuropeYemenZaireZimbabweAzores
Unemployment
Income
Poverty
Unemployment
Labor Participation
Family Structure
Vehicle Availability
Education Level
Disability

Unemployment Comparison

Immigrants from Australia

Costa Ricans

Exceptional
Fair
5.0%
UNEMPLOYMENT
97.0/ 100
METRIC RATING
85th/ 347
METRIC RANK
5.3%
UNEMPLOYMENT
37.4/ 100
METRIC RATING
187th/ 347
METRIC RANK

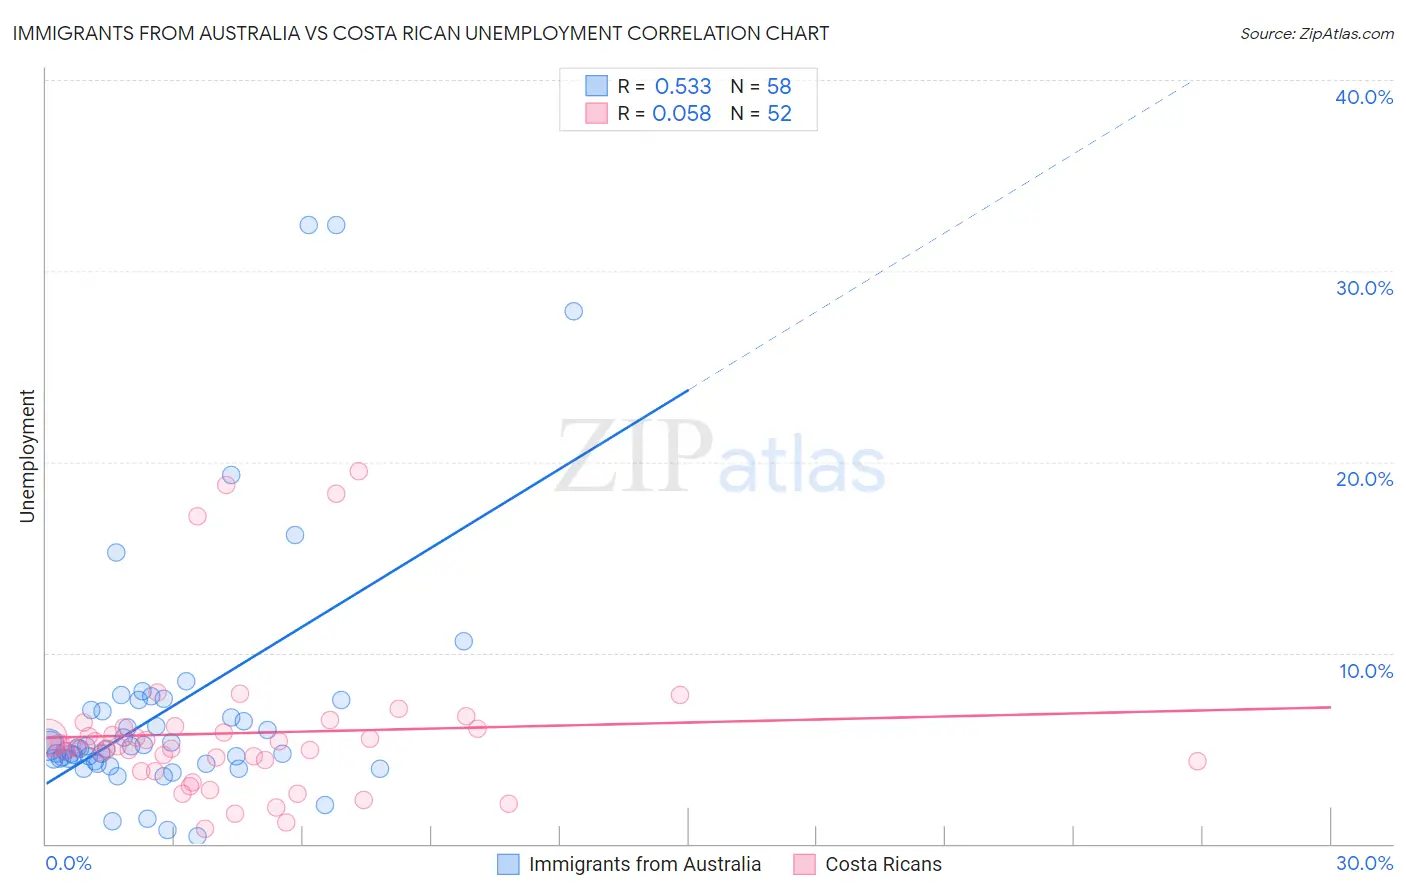
Immigrants from Australia vs Costa Rican Unemployment Correlation Chart

The statistical analysis conducted on geographies consisting of 227,110,462 people shows a substantial positive correlation between the proportion of Immigrants from Australia and unemployment in the United States with a correlation coefficient (R) of 0.533 and weighted average of 5.0%. Similarly, the statistical analysis conducted on geographies consisting of 253,503,792 people shows a slight positive correlation between the proportion of Costa Ricans and unemployment in the United States with a correlation coefficient (R) of 0.058 and weighted average of 5.3%, a difference of 6.5%.
Immigrants from Australia vs Costa Rican Unemployment

Unemployment Correlation Summary

MeasurementImmigrants from AustraliaCosta Rican
Minimum0.40%0.80%
Maximum32.4%19.5%
Range32.0%18.7%
Mean7.0%5.8%
Median5.0%5.1%
Interquartile 25% (IQ1)4.3%4.1%
Interquartile 75% (IQ3)7.0%6.0%
Interquartile Range (IQR)2.7%2.0%
Standard Deviation (Sample)6.5%4.0%
Standard Deviation (Population)6.5%4.0%

Similar Demographics by Unemployment

Demographics Similar to Immigrants from Australia by Unemployment

In terms of unemployment, the demographic groups most similar to Immigrants from Australia are Hungarian (5.0%, a difference of 0.030%), Immigrants from Moldova (5.0%, a difference of 0.18%), Immigrants from Korea (5.0%, a difference of 0.21%), Russian (5.0%, a difference of 0.28%), and Jordanian (5.0%, a difference of 0.30%).
DemographicsRating | RankUnemployment
Okinawans
97.9
/100
|
#78
Exceptional
4.9%
Canadians
97.7
/100
|
#79
Exceptional
5.0%
Immigrants | Sweden
97.6
/100
|
#80
Exceptional
5.0%
Basques
97.6
/100
|
#81
Exceptional
5.0%
Fijians
97.6
/100
|
#82
Exceptional
5.0%
Hmong
97.6
/100
|
#83
Exceptional
5.0%
Russians
97.4
/100
|
#84
Exceptional
5.0%
Immigrants | Australia
97.0
/100
|
#85
Exceptional
5.0%
Hungarians
96.9
/100
|
#86
Exceptional
5.0%
Immigrants | Moldova
96.6
/100
|
#87
Exceptional
5.0%
Immigrants | Korea
96.6
/100
|
#88
Exceptional
5.0%
Jordanians
96.4
/100
|
#89
Exceptional
5.0%
Immigrants | North Macedonia
96.3
/100
|
#90
Exceptional
5.0%
Immigrants | Sudan
96.3
/100
|
#91
Exceptional
5.0%
Immigrants | South Africa
96.2
/100
|
#92
Exceptional
5.0%

Demographics Similar to Costa Ricans by Unemployment

In terms of unemployment, the demographic groups most similar to Costa Ricans are Alsatian (5.3%, a difference of 0.020%), Immigrants from Uganda (5.3%, a difference of 0.030%), Immigrants from Thailand (5.3%, a difference of 0.10%), Assyrian/Chaldean/Syriac (5.3%, a difference of 0.12%), and Immigrants from Belarus (5.3%, a difference of 0.12%).
DemographicsRating | RankUnemployment
Immigrants | Greece
45.0
/100
|
#180
Average
5.3%
Albanians
43.5
/100
|
#181
Average
5.3%
Spaniards
42.2
/100
|
#182
Average
5.3%
Brazilians
40.2
/100
|
#183
Average
5.3%
Assyrians/Chaldeans/Syriacs
39.2
/100
|
#184
Fair
5.3%
Immigrants | Thailand
38.9
/100
|
#185
Fair
5.3%
Immigrants | Uganda
37.8
/100
|
#186
Fair
5.3%
Costa Ricans
37.4
/100
|
#187
Fair
5.3%
Alsatians
37.0
/100
|
#188
Fair
5.3%
Immigrants | Belarus
35.6
/100
|
#189
Fair
5.3%
Arabs
35.3
/100
|
#190
Fair
5.3%
Somalis
34.0
/100
|
#191
Fair
5.3%
South Americans
33.9
/100
|
#192
Fair
5.3%
Immigrants | Somalia
33.8
/100
|
#193
Fair
5.3%
Immigrants | Laos
30.9
/100
|
#194
Fair
5.3%