Ghanaian vs Immigrants from China Unemployment Among Ages 16 to 19 years

COMPARE

Ghanaian
Race
Ancestry
AfghanAfricanAlaska NativeAlaskan AthabascanAlbanianAleutAlsatianAmericanApacheArabArapahoArgentineanArmenianAssyrian/Chaldean/SyriacAustralianAustrianBahamianBangladeshiBarbadianBasqueBelgianBelizeanBermudanBhutaneseBlackfeetBolivianBrazilianBritishBritish West IndianBulgarianBurmeseCajunCambodianCanadianCape VerdeanCarpatho RusynCelticCentral AmericanCentral American IndianCherokeeCheyenneChickasawChileanChineseChippewaChoctawColombianColvilleComancheCosta RicanCreeCreekCroatianCrowCubanCypriotCzechCzechoslovakianDanishDelawareDominicanDutchDutch West IndianEastern EuropeanEcuadorianEgyptianEnglishEstonianEthiopianEuropeanFijianFilipinoFinnishFrenchFrench American IndianFrench CanadianGermanGerman RussianGhanaianGreekGuamanian/ChamorroGuatemalanGuyaneseHaitianHmongHonduranHopiHoumaHungarianIcelanderIndian (Asian)IndonesianInupiatIranianIraqiIrishIroquoisIsraeliItalianJamaicanJapaneseJordanianKenyanKiowaKoreanLaotianLatvianLebaneseLiberianLithuanianLumbeeLuxembourgerMacedonianMalaysianMalteseMarshalleseMenomineeMexicanMexican American IndianMongolianMoroccanNative HawaiianNavajoNepaleseNew ZealanderNicaraguanNigerianNorthern EuropeanNorwegianOkinawanOsageOttawaPaiutePakistaniPalestinianPanamanianParaguayanPennsylvania GermanPeruvianPimaPolishPortuguesePotawatomiPuebloPuerto RicanPuget Sound SalishRomanianRussianSalvadoranSamoanScandinavianScotch-IrishScottishSeminoleSenegaleseSerbianShoshoneSierra LeoneanSiouxSlavicSlovakSloveneSomaliSouth AfricanSouth AmericanSouth American IndianSoviet UnionSpaniardSpanishSpanish AmericanSpanish American IndianSri LankanSubsaharan AfricanSudaneseSwedishSwissSyrianTaiwaneseThaiTlingit-HaidaTohono O'OdhamTonganTrinidadian and TobagonianTsimshianTurkishU.S. Virgin IslanderUgandanUkrainianUruguayanUteVenezuelanVietnameseWelshWest IndianYakamaYaquiYugoslavianYumanYup'ikZimbabwean
Immigration
NonimmigrantsImmigrantsAfghanistanAfricaAlbaniaArgentinaArmeniaAsiaAustraliaAustriaBahamasBangladeshBarbadosBelarusBelgiumBelizeBoliviaBosnia and HerzegovinaBrazilBulgariaBurma/MyanmarCabo VerdeCambodiaCameroonCanadaCaribbeanCentral AmericaChileColombiaCongoCosta RicaCroatiaCubaCzechoslovakiaDenmarkDominicaDominican RepublicEastern AfricaEastern AsiaEastern EuropeEcuadorEgyptEl SalvadorEnglandEritreaEthiopiaEuropeFijiFranceGermanyGhanaGreeceGrenadaGuatemalaGuyanaHaitiHondurasHong KongHungaryIndiaIndonesiaIranIraqIrelandIsraelItalyJamaicaJapanJordanKazakhstanKenyaKoreaKuwaitLaosLatin AmericaLatviaLebanonLiberiaLithuaniaMalaysiaMexicoMicronesiaMiddle AfricaMoldovaMoroccoNepalNetherlandsNicaraguaNigeriaNorth AmericaNorth MacedoniaNorthern AfricaNorthern EuropeNorwayOceaniaPakistanPanamaPeruPhilippinesPolandPortugalRomaniaRussiaSaudi ArabiaScotlandSenegalSerbiaSierra LeoneSingaporeSomaliaSouth AfricaSouth AmericaSouth Central AsiaSouth Eastern AsiaSouthern EuropeSpainSri LankaSt. Vincent and the GrenadinesSudanSwedenSwitzerlandSyriaTaiwanThailandTrinidad and TobagoTurkeyUgandaUkraineUruguayUzbekistanVenezuelaVietnamWest IndiesWestern AfricaWestern AsiaWestern EuropeYemenZaireZimbabweAzores
Immigrants from China
Race
Ancestry
AfghanAfricanAlaska NativeAlaskan AthabascanAlbanianAleutAlsatianAmericanApacheArabArapahoArgentineanArmenianAssyrian/Chaldean/SyriacAustralianAustrianBahamianBangladeshiBarbadianBasqueBelgianBelizeanBermudanBhutaneseBlackfeetBolivianBrazilianBritishBritish West IndianBulgarianBurmeseCajunCambodianCanadianCape VerdeanCarpatho RusynCelticCentral AmericanCentral American IndianCherokeeCheyenneChickasawChileanChineseChippewaChoctawColombianColvilleComancheCosta RicanCreeCreekCroatianCrowCubanCypriotCzechCzechoslovakianDanishDelawareDominicanDutchDutch West IndianEastern EuropeanEcuadorianEgyptianEnglishEstonianEthiopianEuropeanFijianFilipinoFinnishFrenchFrench American IndianFrench CanadianGermanGerman RussianGreekGuamanian/ChamorroGuatemalanGuyaneseHaitianHmongHonduranHopiHoumaHungarianIcelanderIndian (Asian)IndonesianInupiatIranianIraqiIrishIroquoisIsraeliItalianJamaicanJapaneseJordanianKenyanKiowaKoreanLaotianLatvianLebaneseLiberianLithuanianLumbeeLuxembourgerMacedonianMalaysianMalteseMarshalleseMenomineeMexicanMexican American IndianMongolianMoroccanNative HawaiianNavajoNepaleseNew ZealanderNicaraguanNigerianNorthern EuropeanNorwegianOkinawanOsageOttawaPaiutePakistaniPalestinianPanamanianParaguayanPennsylvania GermanPeruvianPimaPolishPortuguesePotawatomiPuebloPuerto RicanPuget Sound SalishRomanianRussianSalvadoranSamoanScandinavianScotch-IrishScottishSeminoleSenegaleseSerbianShoshoneSierra LeoneanSiouxSlavicSlovakSloveneSomaliSouth AfricanSouth AmericanSouth American IndianSoviet UnionSpaniardSpanishSpanish AmericanSpanish American IndianSri LankanSubsaharan AfricanSudaneseSwedishSwissSyrianTaiwaneseThaiTlingit-HaidaTohono O'OdhamTonganTrinidadian and TobagonianTsimshianTurkishU.S. Virgin IslanderUgandanUkrainianUruguayanUteVenezuelanVietnameseWelshWest IndianYakamaYaquiYugoslavianYumanYup'ikZimbabwean
Immigration
NonimmigrantsImmigrantsAfghanistanAfricaAlbaniaArgentinaArmeniaAsiaAustraliaAustriaBahamasBangladeshBarbadosBelarusBelgiumBelizeBoliviaBosnia and HerzegovinaBrazilBulgariaBurma/MyanmarCabo VerdeCambodiaCameroonCanadaCaribbeanCentral AmericaChileChinaColombiaCongoCosta RicaCroatiaCubaCzechoslovakiaDenmarkDominicaDominican RepublicEastern AfricaEastern AsiaEastern EuropeEcuadorEgyptEl SalvadorEnglandEritreaEthiopiaEuropeFijiFranceGermanyGhanaGreeceGrenadaGuatemalaGuyanaHaitiHondurasHong KongHungaryIndiaIndonesiaIranIraqIrelandIsraelItalyJamaicaJapanJordanKazakhstanKenyaKoreaKuwaitLaosLatin AmericaLatviaLebanonLiberiaLithuaniaMalaysiaMexicoMicronesiaMiddle AfricaMoldovaMoroccoNepalNetherlandsNicaraguaNigeriaNorth AmericaNorth MacedoniaNorthern AfricaNorthern EuropeNorwayOceaniaPakistanPanamaPeruPhilippinesPolandPortugalRomaniaRussiaSaudi ArabiaScotlandSenegalSerbiaSierra LeoneSingaporeSomaliaSouth AfricaSouth AmericaSouth Central AsiaSouth Eastern AsiaSouthern EuropeSpainSri LankaSt. Vincent and the GrenadinesSudanSwedenSwitzerlandSyriaTaiwanThailandTrinidad and TobagoTurkeyUgandaUkraineUruguayUzbekistanVenezuelaVietnamWest IndiesWestern AfricaWestern AsiaWestern EuropeYemenZaireZimbabweAzores
Unemployment Among Ages 16 to 19 years
Income
Poverty
Unemployment
Labor Participation
Family Structure
Vehicle Availability
Education Level
Disability

Unemployment Among Ages 16 to 19 years Comparison

Ghanaians

Immigrants from China

Tragic
Good
19.8%
UNEMPLOYMENT AMONG AGES 16 TO 19 YEARS
0.0/ 100
METRIC RATING
285th/ 347
METRIC RANK
17.5%
UNEMPLOYMENT AMONG AGES 16 TO 19 YEARS
64.1/ 100
METRIC RATING
158th/ 347
METRIC RANK

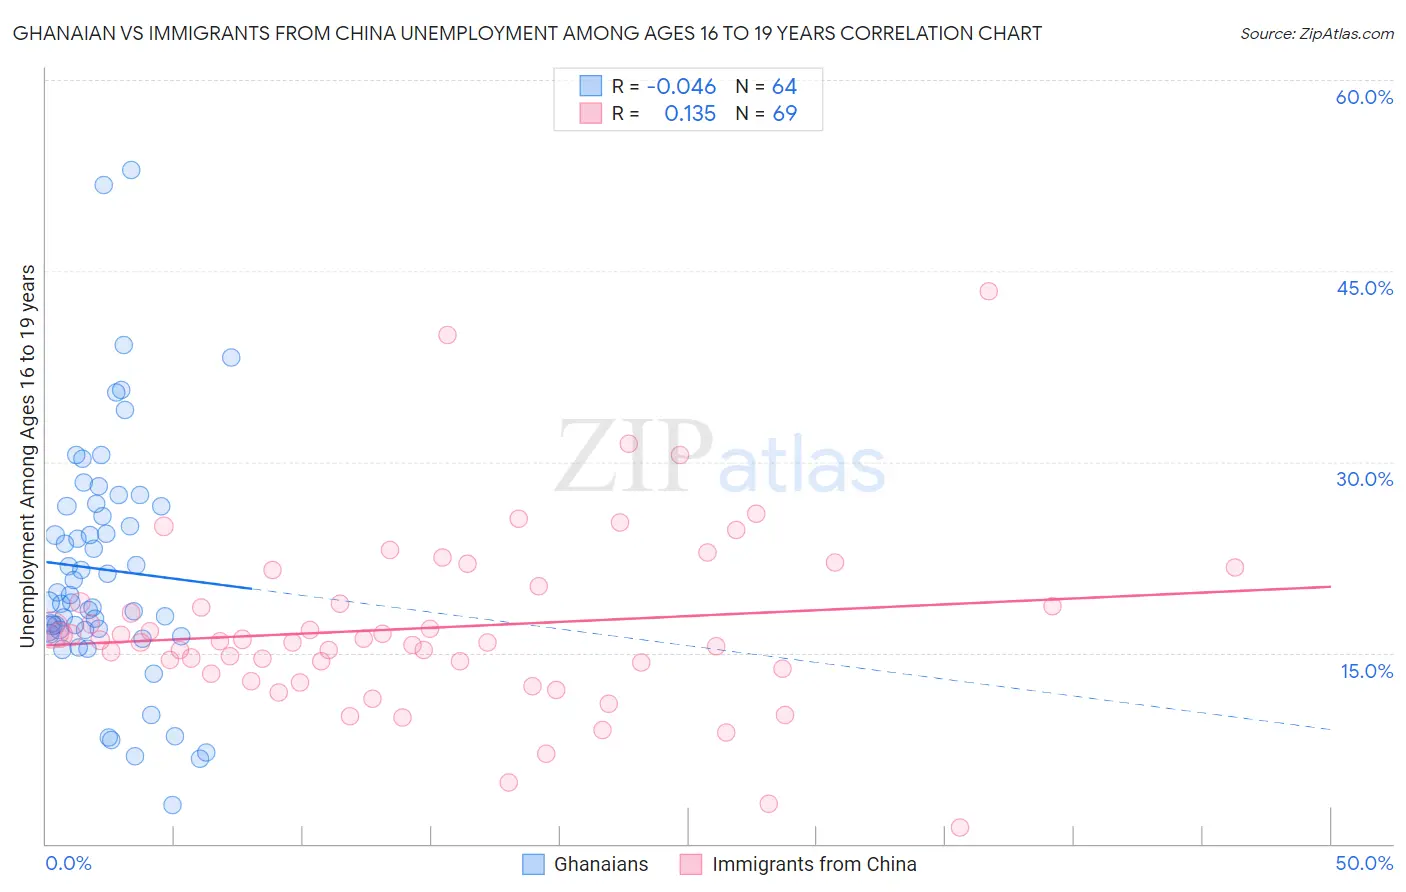
Ghanaian vs Immigrants from China Unemployment Among Ages 16 to 19 years Correlation Chart

The statistical analysis conducted on geographies consisting of 186,967,780 people shows no correlation between the proportion of Ghanaians and unemployment rate among population between the ages 16 and 19 in the United States with a correlation coefficient (R) of -0.046 and weighted average of 19.8%. Similarly, the statistical analysis conducted on geographies consisting of 429,326,144 people shows a poor positive correlation between the proportion of Immigrants from China and unemployment rate among population between the ages 16 and 19 in the United States with a correlation coefficient (R) of 0.135 and weighted average of 17.5%, a difference of 13.2%.
Ghanaian vs Immigrants from China Unemployment Among Ages 16 to 19 years

Unemployment Among Ages 16 to 19 years Correlation Summary

MeasurementGhanaianImmigrants from China
Minimum3.0%1.3%
Maximum52.9%43.4%
Range49.9%42.1%
Mean21.5%17.0%
Median19.3%15.9%
Interquartile 25% (IQ1)16.8%13.6%
Interquartile 75% (IQ3)26.5%19.6%
Interquartile Range (IQR)9.7%6.1%
Standard Deviation (Sample)9.5%7.1%
Standard Deviation (Population)9.5%7.0%

Similar Demographics by Unemployment Among Ages 16 to 19 years

Demographics Similar to Ghanaians by Unemployment Among Ages 16 to 19 years

In terms of unemployment among ages 16 to 19 years, the demographic groups most similar to Ghanaians are Bahamian (19.8%, a difference of 0.12%), Sierra Leonean (19.7%, a difference of 0.18%), Sioux (19.7%, a difference of 0.19%), Immigrants from Ghana (19.8%, a difference of 0.19%), and Dutch West Indian (19.7%, a difference of 0.24%).
DemographicsRating | RankUnemployment Among Ages 16 to 19 years
Africans
0.0
/100
|
#278
Tragic
19.5%
Ute
0.0
/100
|
#279
Tragic
19.6%
Cajuns
0.0
/100
|
#280
Tragic
19.6%
Cypriots
0.0
/100
|
#281
Tragic
19.6%
Dutch West Indians
0.0
/100
|
#282
Tragic
19.7%
Sioux
0.0
/100
|
#283
Tragic
19.7%
Sierra Leoneans
0.0
/100
|
#284
Tragic
19.7%
Ghanaians
0.0
/100
|
#285
Tragic
19.8%
Bahamians
0.0
/100
|
#286
Tragic
19.8%
Immigrants | Ghana
0.0
/100
|
#287
Tragic
19.8%
Immigrants | Azores
0.0
/100
|
#288
Tragic
19.8%
Pueblo
0.0
/100
|
#289
Tragic
19.8%
Immigrants | Sierra Leone
0.0
/100
|
#290
Tragic
20.0%
Immigrants | Yemen
0.0
/100
|
#291
Tragic
20.0%
Comanche
0.0
/100
|
#292
Tragic
20.2%

Demographics Similar to Immigrants from China by Unemployment Among Ages 16 to 19 years

In terms of unemployment among ages 16 to 19 years, the demographic groups most similar to Immigrants from China are Uruguayan (17.5%, a difference of 0.010%), Costa Rican (17.4%, a difference of 0.090%), Korean (17.5%, a difference of 0.16%), Portuguese (17.4%, a difference of 0.17%), and Ukrainian (17.5%, a difference of 0.18%).
DemographicsRating | RankUnemployment Among Ages 16 to 19 years
Immigrants | Hong Kong
69.3
/100
|
#151
Good
17.4%
Immigrants | Northern Africa
69.0
/100
|
#152
Good
17.4%
Immigrants | Afghanistan
68.6
/100
|
#153
Good
17.4%
Afghans
68.1
/100
|
#154
Good
17.4%
Portuguese
67.3
/100
|
#155
Good
17.4%
Costa Ricans
65.9
/100
|
#156
Good
17.4%
Uruguayans
64.3
/100
|
#157
Good
17.5%
Immigrants | China
64.1
/100
|
#158
Good
17.5%
Koreans
61.0
/100
|
#159
Good
17.5%
Ukrainians
60.5
/100
|
#160
Good
17.5%
Immigrants | Denmark
60.3
/100
|
#161
Good
17.5%
Immigrants | Norway
59.8
/100
|
#162
Average
17.5%
Egyptians
59.7
/100
|
#163
Average
17.5%
Immigrants | Austria
57.7
/100
|
#164
Average
17.5%
Cape Verdeans
55.8
/100
|
#165
Average
17.5%