Filipino vs Immigrants from Italy Unemployment
COMPARE
Filipino
Immigrants from Italy
Unemployment
Unemployment Comparison
Filipinos
Immigrants from Italy
4.8%
UNEMPLOYMENT
99.5/ 100
METRIC RATING
42nd/ 347
METRIC RANK
5.1%
UNEMPLOYMENT
79.1/ 100
METRIC RATING
148th/ 347
METRIC RANK
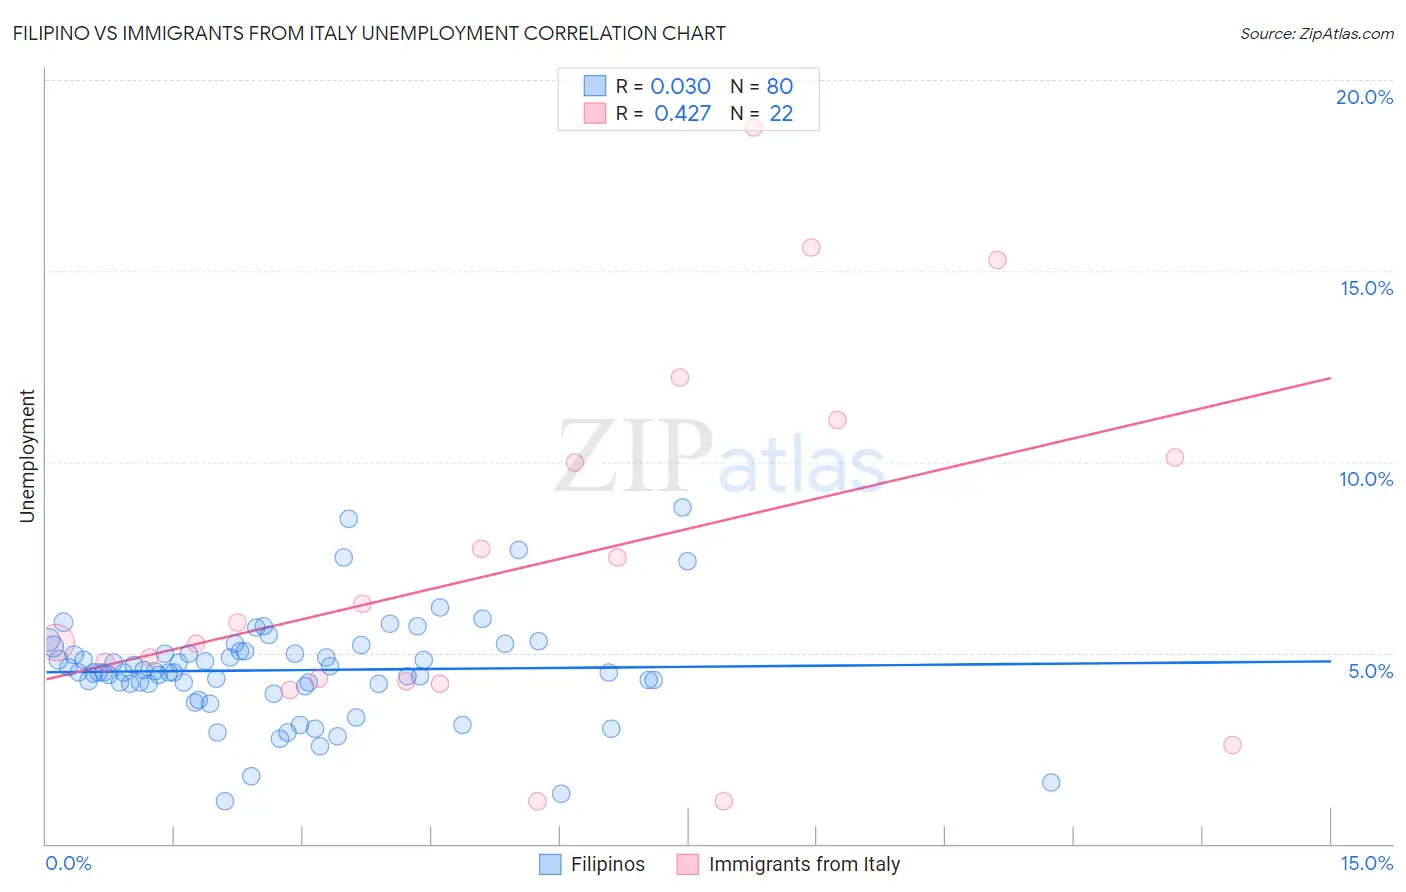
Filipino vs Immigrants from Italy Unemployment Correlation Chart
The statistical analysis conducted on geographies consisting of 254,275,542 people shows no correlation between the proportion of Filipinos and unemployment in the United States with a correlation coefficient (R) of 0.030 and weighted average of 4.8%. Similarly, the statistical analysis conducted on geographies consisting of 324,002,453 people shows a moderate positive correlation between the proportion of Immigrants from Italy and unemployment in the United States with a correlation coefficient (R) of 0.427 and weighted average of 5.1%, a difference of 6.8%.
Unemployment Correlation Summary
| Measurement | Filipino | Immigrants from Italy |
| Minimum | 1.1% | 1.1% |
| Maximum | 8.8% | 18.8% |
| Range | 7.7% | 17.7% |
| Mean | 4.5% | 7.4% |
| Median | 4.5% | 5.5% |
| Interquartile 25% (IQ1) | 4.2% | 4.3% |
| Interquartile 75% (IQ3) | 5.0% | 10.1% |
| Interquartile Range (IQR) | 0.84% | 5.8% |
| Standard Deviation (Sample) | 1.4% | 4.8% |
| Standard Deviation (Population) | 1.4% | 4.7% |
Similar Demographics by Unemployment
Demographics Similar to Filipinos by Unemployment
In terms of unemployment, the demographic groups most similar to Filipinos are Yugoslavian (4.8%, a difference of 0.20%), Austrian (4.8%, a difference of 0.26%), French (4.8%, a difference of 0.31%), Immigrants from Bosnia and Herzegovina (4.8%, a difference of 0.48%), and Immigrants from Nepal (4.8%, a difference of 0.48%).
| Demographics | Rating | Rank | Unemployment |
| Scotch-Irish | 99.8 /100 | #35 | Exceptional 4.8% |
| Tongans | 99.7 /100 | #36 | Exceptional 4.8% |
| Czechoslovakians | 99.7 /100 | #37 | Exceptional 4.8% |
| Bolivians | 99.7 /100 | #38 | Exceptional 4.8% |
| Lithuanians | 99.7 /100 | #39 | Exceptional 4.8% |
| Northern Europeans | 99.7 /100 | #40 | Exceptional 4.8% |
| Immigrants | Bosnia and Herzegovina | 99.7 /100 | #41 | Exceptional 4.8% |
| Filipinos | 99.5 /100 | #42 | Exceptional 4.8% |
| Yugoslavians | 99.5 /100 | #43 | Exceptional 4.8% |
| Austrians | 99.5 /100 | #44 | Exceptional 4.8% |
| French | 99.5 /100 | #45 | Exceptional 4.8% |
| Immigrants | Nepal | 99.4 /100 | #46 | Exceptional 4.8% |
| Immigrants | Taiwan | 99.4 /100 | #47 | Exceptional 4.8% |
| Immigrants | Scotland | 99.3 /100 | #48 | Exceptional 4.9% |
| Immigrants | South Central Asia | 99.3 /100 | #49 | Exceptional 4.9% |
Demographics Similar to Immigrants from Italy by Unemployment
In terms of unemployment, the demographic groups most similar to Immigrants from Italy are Syrian (5.2%, a difference of 0.13%), Indian (Asian) (5.1%, a difference of 0.26%), Potawatomi (5.2%, a difference of 0.26%), Immigrants from Norway (5.1%, a difference of 0.27%), and Immigrants from Asia (5.1%, a difference of 0.27%).
| Demographics | Rating | Rank | Unemployment |
| Palestinians | 83.4 /100 | #141 | Excellent 5.1% |
| Immigrants | Pakistan | 83.2 /100 | #142 | Excellent 5.1% |
| Immigrants | Chile | 82.8 /100 | #143 | Excellent 5.1% |
| Indonesians | 82.3 /100 | #144 | Excellent 5.1% |
| Immigrants | Norway | 81.8 /100 | #145 | Excellent 5.1% |
| Immigrants | Asia | 81.8 /100 | #146 | Excellent 5.1% |
| Indians (Asian) | 81.6 /100 | #147 | Excellent 5.1% |
| Immigrants | Italy | 79.1 /100 | #148 | Good 5.1% |
| Syrians | 77.7 /100 | #149 | Good 5.2% |
| Potawatomi | 76.2 /100 | #150 | Good 5.2% |
| Immigrants | Eastern Europe | 75.3 /100 | #151 | Good 5.2% |
| Immigrants | Hong Kong | 75.2 /100 | #152 | Good 5.2% |
| Egyptians | 75.2 /100 | #153 | Good 5.2% |
| Immigrants | China | 74.7 /100 | #154 | Good 5.2% |
| Immigrants | Northern Africa | 71.3 /100 | #155 | Good 5.2% |