Egyptian vs Immigrants from Peru Male Unemployment

COMPARE

Egyptian
Race
Ancestry
AfghanAfricanAlaska NativeAlaskan AthabascanAlbanianAleutAlsatianAmericanApacheArabArapahoArgentineanArmenianAssyrian/Chaldean/SyriacAustralianAustrianBahamianBangladeshiBarbadianBasqueBelgianBelizeanBermudanBhutaneseBlackfeetBolivianBrazilianBritishBritish West IndianBulgarianBurmeseCajunCambodianCanadianCape VerdeanCarpatho RusynCelticCentral AmericanCentral American IndianCherokeeCheyenneChickasawChileanChineseChippewaChoctawColombianColvilleComancheCosta RicanCreeCreekCroatianCrowCubanCypriotCzechCzechoslovakianDanishDelawareDominicanDutchDutch West IndianEastern EuropeanEcuadorianEgyptianEnglishEstonianEthiopianEuropeanFijianFilipinoFinnishFrenchFrench American IndianFrench CanadianGermanGerman RussianGhanaianGreekGuamanian/ChamorroGuatemalanGuyaneseHaitianHmongHonduranHopiHoumaHungarianIcelanderIndian (Asian)IndonesianInupiatIranianIraqiIrishIroquoisIsraeliItalianJamaicanJapaneseJordanianKenyanKiowaKoreanLaotianLatvianLebaneseLiberianLithuanianLumbeeLuxembourgerMacedonianMalaysianMalteseMarshalleseMenomineeMexicanMexican American IndianMongolianMoroccanNative HawaiianNavajoNepaleseNew ZealanderNicaraguanNigerianNorthern EuropeanNorwegianOkinawanOsageOttawaPaiutePakistaniPalestinianPanamanianParaguayanPennsylvania GermanPeruvianPimaPolishPortuguesePotawatomiPuebloPuerto RicanPuget Sound SalishRomanianRussianSalvadoranSamoanScandinavianScotch-IrishScottishSeminoleSenegaleseSerbianShoshoneSierra LeoneanSiouxSlavicSlovakSloveneSomaliSouth AfricanSouth AmericanSouth American IndianSoviet UnionSpaniardSpanishSpanish AmericanSpanish American IndianSri LankanSubsaharan AfricanSudaneseSwedishSwissSyrianTaiwaneseThaiTlingit-HaidaTohono O'OdhamTonganTrinidadian and TobagonianTsimshianTurkishU.S. Virgin IslanderUgandanUkrainianUruguayanUteVenezuelanVietnameseWelshWest IndianYakamaYaquiYugoslavianYumanYup'ikZimbabwean
Immigration
NonimmigrantsImmigrantsAfghanistanAfricaAlbaniaArgentinaArmeniaAsiaAustraliaAustriaBahamasBangladeshBarbadosBelarusBelgiumBelizeBoliviaBosnia and HerzegovinaBrazilBulgariaBurma/MyanmarCabo VerdeCambodiaCameroonCanadaCaribbeanCentral AmericaChileChinaColombiaCongoCosta RicaCroatiaCubaCzechoslovakiaDenmarkDominicaDominican RepublicEastern AfricaEastern AsiaEastern EuropeEcuadorEgyptEl SalvadorEnglandEritreaEthiopiaEuropeFijiFranceGermanyGhanaGreeceGrenadaGuatemalaGuyanaHaitiHondurasHong KongHungaryIndiaIndonesiaIranIraqIrelandIsraelItalyJamaicaJapanJordanKazakhstanKenyaKoreaKuwaitLaosLatin AmericaLatviaLebanonLiberiaLithuaniaMalaysiaMexicoMicronesiaMiddle AfricaMoldovaMoroccoNepalNetherlandsNicaraguaNigeriaNorth AmericaNorth MacedoniaNorthern AfricaNorthern EuropeNorwayOceaniaPakistanPanamaPhilippinesPolandPortugalRomaniaRussiaSaudi ArabiaScotlandSenegalSerbiaSierra LeoneSingaporeSomaliaSouth AfricaSouth AmericaSouth Central AsiaSouth Eastern AsiaSouthern EuropeSpainSri LankaSt. Vincent and the GrenadinesSudanSwedenSwitzerlandSyriaTaiwanThailandTrinidad and TobagoTurkeyUgandaUkraineUruguayUzbekistanVenezuelaVietnamWest IndiesWestern AfricaWestern AsiaWestern EuropeYemenZaireZimbabweAzores
Immigrants from Peru
Race
Ancestry
AfghanAfricanAlaska NativeAlaskan AthabascanAlbanianAleutAlsatianAmericanApacheArabArapahoArgentineanArmenianAssyrian/Chaldean/SyriacAustralianAustrianBahamianBangladeshiBarbadianBasqueBelgianBelizeanBermudanBhutaneseBlackfeetBolivianBrazilianBritishBritish West IndianBulgarianBurmeseCajunCambodianCanadianCape VerdeanCarpatho RusynCelticCentral AmericanCentral American IndianCherokeeCheyenneChickasawChileanChineseChippewaChoctawColombianColvilleComancheCosta RicanCreeCreekCroatianCrowCubanCypriotCzechCzechoslovakianDanishDelawareDominicanDutchDutch West IndianEastern EuropeanEcuadorianEnglishEstonianEthiopianEuropeanFijianFilipinoFinnishFrenchFrench American IndianFrench CanadianGermanGerman RussianGhanaianGreekGuamanian/ChamorroGuatemalanGuyaneseHaitianHmongHonduranHopiHoumaHungarianIcelanderIndian (Asian)IndonesianInupiatIranianIraqiIrishIroquoisIsraeliItalianJamaicanJapaneseJordanianKenyanKiowaKoreanLaotianLatvianLebaneseLiberianLithuanianLumbeeLuxembourgerMacedonianMalaysianMalteseMarshalleseMenomineeMexicanMexican American IndianMongolianMoroccanNative HawaiianNavajoNepaleseNew ZealanderNicaraguanNigerianNorthern EuropeanNorwegianOkinawanOsageOttawaPaiutePakistaniPalestinianPanamanianParaguayanPennsylvania GermanPeruvianPimaPolishPortuguesePotawatomiPuebloPuerto RicanPuget Sound SalishRomanianRussianSalvadoranSamoanScandinavianScotch-IrishScottishSeminoleSenegaleseSerbianShoshoneSierra LeoneanSiouxSlavicSlovakSloveneSomaliSouth AfricanSouth AmericanSouth American IndianSoviet UnionSpaniardSpanishSpanish AmericanSpanish American IndianSri LankanSubsaharan AfricanSudaneseSwedishSwissSyrianTaiwaneseThaiTlingit-HaidaTohono O'OdhamTonganTrinidadian and TobagonianTsimshianTurkishU.S. Virgin IslanderUgandanUkrainianUruguayanUteVenezuelanVietnameseWelshWest IndianYakamaYaquiYugoslavianYumanYup'ikZimbabwean
Immigration
NonimmigrantsImmigrantsAfghanistanAfricaAlbaniaArgentinaArmeniaAsiaAustraliaAustriaBahamasBangladeshBarbadosBelarusBelgiumBelizeBoliviaBosnia and HerzegovinaBrazilBulgariaBurma/MyanmarCabo VerdeCambodiaCameroonCanadaCaribbeanCentral AmericaChileChinaColombiaCongoCosta RicaCroatiaCubaCzechoslovakiaDenmarkDominicaDominican RepublicEastern AfricaEastern AsiaEastern EuropeEcuadorEgyptEl SalvadorEnglandEritreaEthiopiaEuropeFijiFranceGermanyGhanaGreeceGrenadaGuatemalaGuyanaHaitiHondurasHong KongHungaryIndiaIndonesiaIranIraqIrelandIsraelItalyJamaicaJapanJordanKazakhstanKenyaKoreaKuwaitLaosLatin AmericaLatviaLebanonLiberiaLithuaniaMalaysiaMexicoMicronesiaMiddle AfricaMoldovaMoroccoNepalNetherlandsNicaraguaNigeriaNorth AmericaNorth MacedoniaNorthern AfricaNorthern EuropeNorwayOceaniaPakistanPanamaPeruPhilippinesPolandPortugalRomaniaRussiaSaudi ArabiaScotlandSenegalSerbiaSierra LeoneSingaporeSomaliaSouth AfricaSouth AmericaSouth Central AsiaSouth Eastern AsiaSouthern EuropeSpainSri LankaSt. Vincent and the GrenadinesSudanSwedenSwitzerlandSyriaTaiwanThailandTrinidad and TobagoTurkeyUgandaUkraineUruguayUzbekistanVenezuelaVietnamWest IndiesWestern AfricaWestern AsiaWestern EuropeYemenZaireZimbabweAzores
Male Unemployment
Income
Poverty
Unemployment
Labor Participation
Family Structure
Vehicle Availability
Education Level
Disability

Male Unemployment Comparison

Egyptians

Immigrants from Peru

Good
Average
5.2%
MALE UNEMPLOYMENT
74.8/ 100
METRIC RATING
152nd/ 347
METRIC RANK
5.3%
MALE UNEMPLOYMENT
44.6/ 100
METRIC RATING
177th/ 347
METRIC RANK

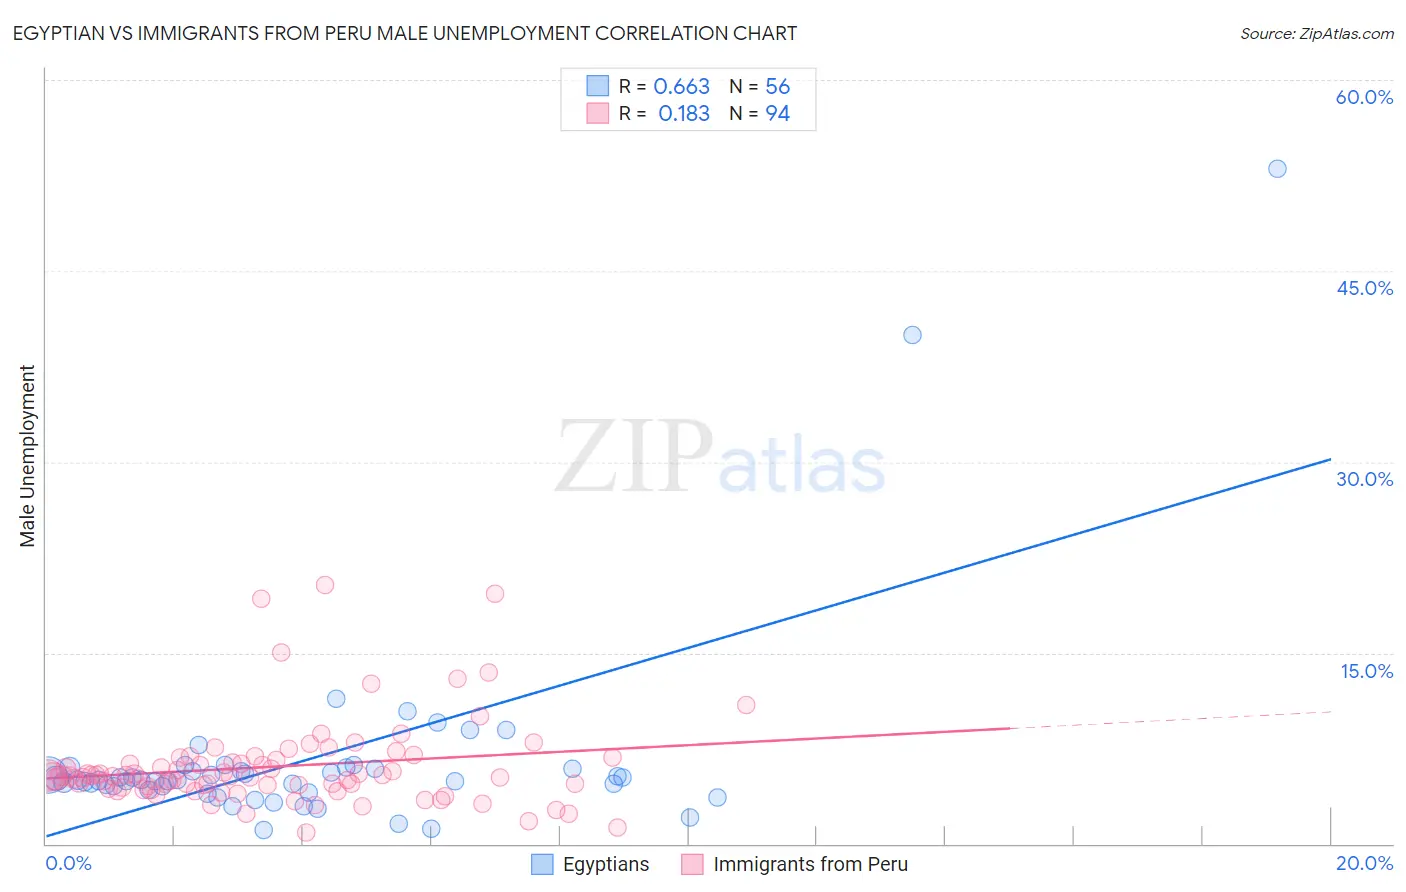
Egyptian vs Immigrants from Peru Male Unemployment Correlation Chart

The statistical analysis conducted on geographies consisting of 276,492,252 people shows a significant positive correlation between the proportion of Egyptians and unemployment rate among males in the United States with a correlation coefficient (R) of 0.663 and weighted average of 5.2%. Similarly, the statistical analysis conducted on geographies consisting of 328,103,434 people shows a poor positive correlation between the proportion of Immigrants from Peru and unemployment rate among males in the United States with a correlation coefficient (R) of 0.183 and weighted average of 5.3%, a difference of 1.9%.
Egyptian vs Immigrants from Peru Male Unemployment

Male Unemployment Correlation Summary

MeasurementEgyptianImmigrants from Peru
Minimum1.1%0.90%
Maximum53.0%20.3%
Range51.9%19.4%
Mean6.6%6.1%
Median5.0%5.3%
Interquartile 25% (IQ1)4.4%4.5%
Interquartile 75% (IQ3)5.9%6.6%
Interquartile Range (IQR)1.5%2.1%
Standard Deviation (Sample)8.1%3.4%
Standard Deviation (Population)8.0%3.4%

Similar Demographics by Male Unemployment

Demographics Similar to Egyptians by Male Unemployment

In terms of male unemployment, the demographic groups most similar to Egyptians are Slovak (5.2%, a difference of 0.050%), Immigrants from Uruguay (5.2%, a difference of 0.070%), Laotian (5.2%, a difference of 0.080%), Indian (Asian) (5.2%, a difference of 0.090%), and Immigrants from Europe (5.2%, a difference of 0.11%).
DemographicsRating | RankMale Unemployment
Macedonians
77.7
/100
|
#145
Good
5.2%
Immigrants | Kenya
77.6
/100
|
#146
Good
5.2%
Immigrants | Burma/Myanmar
77.5
/100
|
#147
Good
5.2%
Immigrants | Italy
76.3
/100
|
#148
Good
5.2%
Immigrants | Europe
76.2
/100
|
#149
Good
5.2%
Indians (Asian)
76.0
/100
|
#150
Good
5.2%
Slovaks
75.5
/100
|
#151
Good
5.2%
Egyptians
74.8
/100
|
#152
Good
5.2%
Immigrants | Uruguay
73.9
/100
|
#153
Good
5.2%
Laotians
73.8
/100
|
#154
Good
5.2%
Immigrants | Hungary
73.4
/100
|
#155
Good
5.2%
Americans
72.7
/100
|
#156
Good
5.2%
Immigrants | Northern Africa
72.3
/100
|
#157
Good
5.2%
Immigrants | Indonesia
71.5
/100
|
#158
Good
5.2%
Indonesians
71.2
/100
|
#159
Good
5.2%

Demographics Similar to Immigrants from Peru by Male Unemployment

In terms of male unemployment, the demographic groups most similar to Immigrants from Peru are Immigrants from Poland (5.3%, a difference of 0.080%), Osage (5.3%, a difference of 0.13%), Immigrants from Iraq (5.3%, a difference of 0.20%), Immigrants from Oceania (5.3%, a difference of 0.23%), and Malaysian (5.3%, a difference of 0.30%).
DemographicsRating | RankMale Unemployment
Immigrants | Eastern Europe
54.1
/100
|
#170
Average
5.3%
Peruvians
51.9
/100
|
#171
Average
5.3%
Immigrants | Kazakhstan
50.8
/100
|
#172
Average
5.3%
Immigrants | Russia
50.7
/100
|
#173
Average
5.3%
Immigrants | Iran
50.0
/100
|
#174
Average
5.3%
Immigrants | Iraq
48.1
/100
|
#175
Average
5.3%
Immigrants | Poland
46.0
/100
|
#176
Average
5.3%
Immigrants | Peru
44.6
/100
|
#177
Average
5.3%
Osage
42.5
/100
|
#178
Average
5.3%
Immigrants | Oceania
40.8
/100
|
#179
Average
5.3%
Malaysians
39.6
/100
|
#180
Fair
5.3%
Immigrants | Afghanistan
37.9
/100
|
#181
Fair
5.3%
Potawatomi
37.8
/100
|
#182
Fair
5.3%
Taiwanese
37.6
/100
|
#183
Fair
5.3%
Spaniards
35.1
/100
|
#184
Fair
5.3%