Czech vs Immigrants from Australia Male Unemployment

COMPARE

Czech
Race
Ancestry
AfghanAfricanAlaska NativeAlaskan AthabascanAlbanianAleutAlsatianAmericanApacheArabArapahoArgentineanArmenianAssyrian/Chaldean/SyriacAustralianAustrianBahamianBangladeshiBarbadianBasqueBelgianBelizeanBermudanBhutaneseBlackfeetBolivianBrazilianBritishBritish West IndianBulgarianBurmeseCajunCambodianCanadianCape VerdeanCarpatho RusynCelticCentral AmericanCentral American IndianCherokeeCheyenneChickasawChileanChineseChippewaChoctawColombianColvilleComancheCosta RicanCreeCreekCroatianCrowCubanCypriotCzechCzechoslovakianDanishDelawareDominicanDutchDutch West IndianEastern EuropeanEcuadorianEgyptianEnglishEstonianEthiopianEuropeanFijianFilipinoFinnishFrenchFrench American IndianFrench CanadianGermanGerman RussianGhanaianGreekGuamanian/ChamorroGuatemalanGuyaneseHaitianHmongHonduranHopiHoumaHungarianIcelanderIndian (Asian)IndonesianInupiatIranianIraqiIrishIroquoisIsraeliItalianJamaicanJapaneseJordanianKenyanKiowaKoreanLaotianLatvianLebaneseLiberianLithuanianLumbeeLuxembourgerMacedonianMalaysianMalteseMarshalleseMenomineeMexicanMexican American IndianMongolianMoroccanNative HawaiianNavajoNepaleseNew ZealanderNicaraguanNigerianNorthern EuropeanNorwegianOkinawanOsageOttawaPaiutePakistaniPalestinianPanamanianParaguayanPennsylvania GermanPeruvianPimaPolishPortuguesePotawatomiPuebloPuerto RicanPuget Sound SalishRomanianRussianSalvadoranSamoanScandinavianScotch-IrishScottishSeminoleSenegaleseSerbianShoshoneSierra LeoneanSiouxSlavicSlovakSloveneSomaliSouth AfricanSouth AmericanSouth American IndianSoviet UnionSpaniardSpanishSpanish AmericanSpanish American IndianSri LankanSubsaharan AfricanSudaneseSwedishSwissSyrianTaiwaneseThaiTlingit-HaidaTohono O'OdhamTonganTrinidadian and TobagonianTsimshianTurkishU.S. Virgin IslanderUgandanUkrainianUruguayanUteVenezuelanVietnameseWelshWest IndianYakamaYaquiYugoslavianYumanYup'ikZimbabwean
Immigration
NonimmigrantsImmigrantsAfghanistanAfricaAlbaniaArgentinaArmeniaAsiaAustriaBahamasBangladeshBarbadosBelarusBelgiumBelizeBoliviaBosnia and HerzegovinaBrazilBulgariaBurma/MyanmarCabo VerdeCambodiaCameroonCanadaCaribbeanCentral AmericaChileChinaColombiaCongoCosta RicaCroatiaCubaCzechoslovakiaDenmarkDominicaDominican RepublicEastern AfricaEastern AsiaEastern EuropeEcuadorEgyptEl SalvadorEnglandEritreaEthiopiaEuropeFijiFranceGermanyGhanaGreeceGrenadaGuatemalaGuyanaHaitiHondurasHong KongHungaryIndiaIndonesiaIranIraqIrelandIsraelItalyJamaicaJapanJordanKazakhstanKenyaKoreaKuwaitLaosLatin AmericaLatviaLebanonLiberiaLithuaniaMalaysiaMexicoMicronesiaMiddle AfricaMoldovaMoroccoNepalNetherlandsNicaraguaNigeriaNorth AmericaNorth MacedoniaNorthern AfricaNorthern EuropeNorwayOceaniaPakistanPanamaPeruPhilippinesPolandPortugalRomaniaRussiaSaudi ArabiaScotlandSenegalSerbiaSierra LeoneSingaporeSomaliaSouth AfricaSouth AmericaSouth Central AsiaSouth Eastern AsiaSouthern EuropeSpainSri LankaSt. Vincent and the GrenadinesSudanSwedenSwitzerlandSyriaTaiwanThailandTrinidad and TobagoTurkeyUgandaUkraineUruguayUzbekistanVenezuelaVietnamWest IndiesWestern AfricaWestern AsiaWestern EuropeYemenZaireZimbabweAzores
Immigrants from Australia
Race
Ancestry
AfghanAfricanAlaska NativeAlaskan AthabascanAlbanianAleutAlsatianAmericanApacheArabArapahoArgentineanArmenianAssyrian/Chaldean/SyriacAustralianAustrianBahamianBangladeshiBarbadianBasqueBelgianBelizeanBermudanBhutaneseBlackfeetBolivianBrazilianBritishBritish West IndianBulgarianBurmeseCajunCambodianCanadianCape VerdeanCarpatho RusynCelticCentral AmericanCentral American IndianCherokeeCheyenneChickasawChileanChineseChippewaChoctawColombianColvilleComancheCosta RicanCreeCreekCroatianCrowCubanCypriotCzechoslovakianDanishDelawareDominicanDutchDutch West IndianEastern EuropeanEcuadorianEgyptianEnglishEstonianEthiopianEuropeanFijianFilipinoFinnishFrenchFrench American IndianFrench CanadianGermanGerman RussianGhanaianGreekGuamanian/ChamorroGuatemalanGuyaneseHaitianHmongHonduranHopiHoumaHungarianIcelanderIndian (Asian)IndonesianInupiatIranianIraqiIrishIroquoisIsraeliItalianJamaicanJapaneseJordanianKenyanKiowaKoreanLaotianLatvianLebaneseLiberianLithuanianLumbeeLuxembourgerMacedonianMalaysianMalteseMarshalleseMenomineeMexicanMexican American IndianMongolianMoroccanNative HawaiianNavajoNepaleseNew ZealanderNicaraguanNigerianNorthern EuropeanNorwegianOkinawanOsageOttawaPaiutePakistaniPalestinianPanamanianParaguayanPennsylvania GermanPeruvianPimaPolishPortuguesePotawatomiPuebloPuerto RicanPuget Sound SalishRomanianRussianSalvadoranSamoanScandinavianScotch-IrishScottishSeminoleSenegaleseSerbianShoshoneSierra LeoneanSiouxSlavicSlovakSloveneSomaliSouth AfricanSouth AmericanSouth American IndianSoviet UnionSpaniardSpanishSpanish AmericanSpanish American IndianSri LankanSubsaharan AfricanSudaneseSwedishSwissSyrianTaiwaneseThaiTlingit-HaidaTohono O'OdhamTonganTrinidadian and TobagonianTsimshianTurkishU.S. Virgin IslanderUgandanUkrainianUruguayanUteVenezuelanVietnameseWelshWest IndianYakamaYaquiYugoslavianYumanYup'ikZimbabwean
Immigration
NonimmigrantsImmigrantsAfghanistanAfricaAlbaniaArgentinaArmeniaAsiaAustraliaAustriaBahamasBangladeshBarbadosBelarusBelgiumBelizeBoliviaBosnia and HerzegovinaBrazilBulgariaBurma/MyanmarCabo VerdeCambodiaCameroonCanadaCaribbeanCentral AmericaChileChinaColombiaCongoCosta RicaCroatiaCubaCzechoslovakiaDenmarkDominicaDominican RepublicEastern AfricaEastern AsiaEastern EuropeEcuadorEgyptEl SalvadorEnglandEritreaEthiopiaEuropeFijiFranceGermanyGhanaGreeceGrenadaGuatemalaGuyanaHaitiHondurasHong KongHungaryIndiaIndonesiaIranIraqIrelandIsraelItalyJamaicaJapanJordanKazakhstanKenyaKoreaKuwaitLaosLatin AmericaLatviaLebanonLiberiaLithuaniaMalaysiaMexicoMicronesiaMiddle AfricaMoldovaMoroccoNepalNetherlandsNicaraguaNigeriaNorth AmericaNorth MacedoniaNorthern AfricaNorthern EuropeNorwayOceaniaPakistanPanamaPeruPhilippinesPolandPortugalRomaniaRussiaSaudi ArabiaScotlandSenegalSerbiaSierra LeoneSingaporeSomaliaSouth AfricaSouth AmericaSouth Central AsiaSouth Eastern AsiaSouthern EuropeSpainSri LankaSt. Vincent and the GrenadinesSudanSwedenSwitzerlandSyriaTaiwanThailandTrinidad and TobagoTurkeyUgandaUkraineUruguayUzbekistanVenezuelaVietnamWest IndiesWestern AfricaWestern AsiaWestern EuropeYemenZaireZimbabweAzores
Male Unemployment
Income
Poverty
Unemployment
Labor Participation
Family Structure
Vehicle Availability
Education Level
Disability

Male Unemployment Comparison

Czechs

Immigrants from Australia

Exceptional
Exceptional
4.5%
MALE UNEMPLOYMENT
100.0/ 100
METRIC RATING
7th/ 347
METRIC RANK
5.1%
MALE UNEMPLOYMENT
94.7/ 100
METRIC RATING
89th/ 347
METRIC RANK

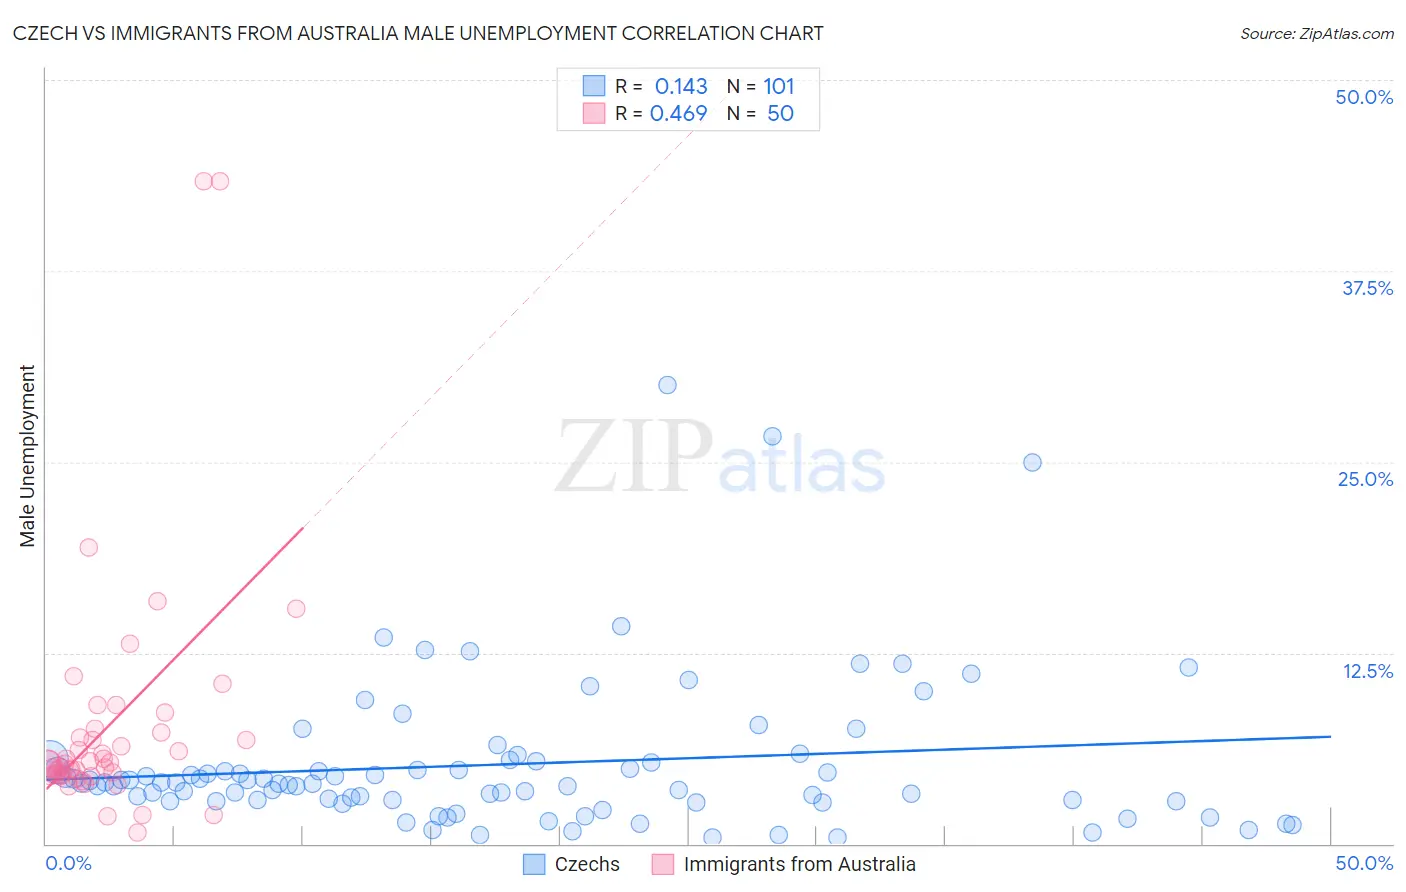
Czech vs Immigrants from Australia Male Unemployment Correlation Chart

The statistical analysis conducted on geographies consisting of 479,698,612 people shows a poor positive correlation between the proportion of Czechs and unemployment rate among males in the United States with a correlation coefficient (R) of 0.143 and weighted average of 4.5%. Similarly, the statistical analysis conducted on geographies consisting of 226,690,486 people shows a moderate positive correlation between the proportion of Immigrants from Australia and unemployment rate among males in the United States with a correlation coefficient (R) of 0.469 and weighted average of 5.1%, a difference of 12.1%.
Czech vs Immigrants from Australia Male Unemployment

Male Unemployment Correlation Summary

MeasurementCzechImmigrants from Australia
Minimum0.40%0.70%
Maximum30.0%43.4%
Range29.6%42.7%
Mean5.2%7.8%
Median4.0%5.3%
Interquartile 25% (IQ1)2.8%4.5%
Interquartile 75% (IQ3)5.4%7.3%
Interquartile Range (IQR)2.6%2.8%
Standard Deviation (Sample)5.0%8.2%
Standard Deviation (Population)5.0%8.1%

Similar Demographics by Male Unemployment

Demographics Similar to Czechs by Male Unemployment

In terms of male unemployment, the demographic groups most similar to Czechs are Venezuelan (4.5%, a difference of 0.20%), Luxembourger (4.5%, a difference of 0.26%), Danish (4.5%, a difference of 0.65%), Thai (4.6%, a difference of 1.5%), and Immigrants from Venezuela (4.4%, a difference of 1.7%).
DemographicsRating | RankMale Unemployment
Immigrants | India
100.0
/100
|
#1
Exceptional
4.4%
Immigrants | Cuba
100.0
/100
|
#2
Exceptional
4.4%
Norwegians
100.0
/100
|
#3
Exceptional
4.4%
Immigrants | Venezuela
100.0
/100
|
#4
Exceptional
4.4%
Danes
100.0
/100
|
#5
Exceptional
4.5%
Venezuelans
100.0
/100
|
#6
Exceptional
4.5%
Czechs
100.0
/100
|
#7
Exceptional
4.5%
Luxembourgers
100.0
/100
|
#8
Exceptional
4.5%
Thais
100.0
/100
|
#9
Exceptional
4.6%
Cubans
100.0
/100
|
#10
Exceptional
4.6%
Swedes
100.0
/100
|
#11
Exceptional
4.6%
Immigrants | Bolivia
100.0
/100
|
#12
Exceptional
4.7%
Bolivians
100.0
/100
|
#13
Exceptional
4.7%
Germans
100.0
/100
|
#14
Exceptional
4.7%
Scandinavians
100.0
/100
|
#15
Exceptional
4.7%

Demographics Similar to Immigrants from Australia by Male Unemployment

In terms of male unemployment, the demographic groups most similar to Immigrants from Australia are Okinawan (5.1%, a difference of 0.010%), Immigrants from Sri Lanka (5.1%, a difference of 0.040%), Immigrants from Turkey (5.1%, a difference of 0.090%), Slavic (5.1%, a difference of 0.14%), and Immigrants from Serbia (5.1%, a difference of 0.15%).
DemographicsRating | RankMale Unemployment
Chileans
96.2
/100
|
#82
Exceptional
5.0%
Immigrants | Eritrea
96.0
/100
|
#83
Exceptional
5.0%
Serbians
95.7
/100
|
#84
Exceptional
5.1%
Immigrants | North Macedonia
95.6
/100
|
#85
Exceptional
5.1%
Maltese
95.5
/100
|
#86
Exceptional
5.1%
Immigrants | Romania
95.4
/100
|
#87
Exceptional
5.1%
Immigrants | Sri Lanka
94.9
/100
|
#88
Exceptional
5.1%
Immigrants | Australia
94.7
/100
|
#89
Exceptional
5.1%
Okinawans
94.7
/100
|
#90
Exceptional
5.1%
Immigrants | Turkey
94.4
/100
|
#91
Exceptional
5.1%
Slavs
94.2
/100
|
#92
Exceptional
5.1%
Immigrants | Serbia
94.2
/100
|
#93
Exceptional
5.1%
Canadians
94.1
/100
|
#94
Exceptional
5.1%
Italians
93.8
/100
|
#95
Exceptional
5.1%
Asians
93.7
/100
|
#96
Exceptional
5.1%