Czechoslovakian vs West Indian Unemployment Among Ages 16 to 19 years
COMPARE
Czechoslovakian
West Indian
Unemployment Among Ages 16 to 19 years
Unemployment Among Ages 16 to 19 years Comparison
Czechoslovakians
West Indians
16.5%
UNEMPLOYMENT AMONG AGES 16 TO 19 YEARS
99.5/ 100
METRIC RATING
55th/ 347
METRIC RANK
22.4%
UNEMPLOYMENT AMONG AGES 16 TO 19 YEARS
0.0/ 100
METRIC RATING
321st/ 347
METRIC RANK
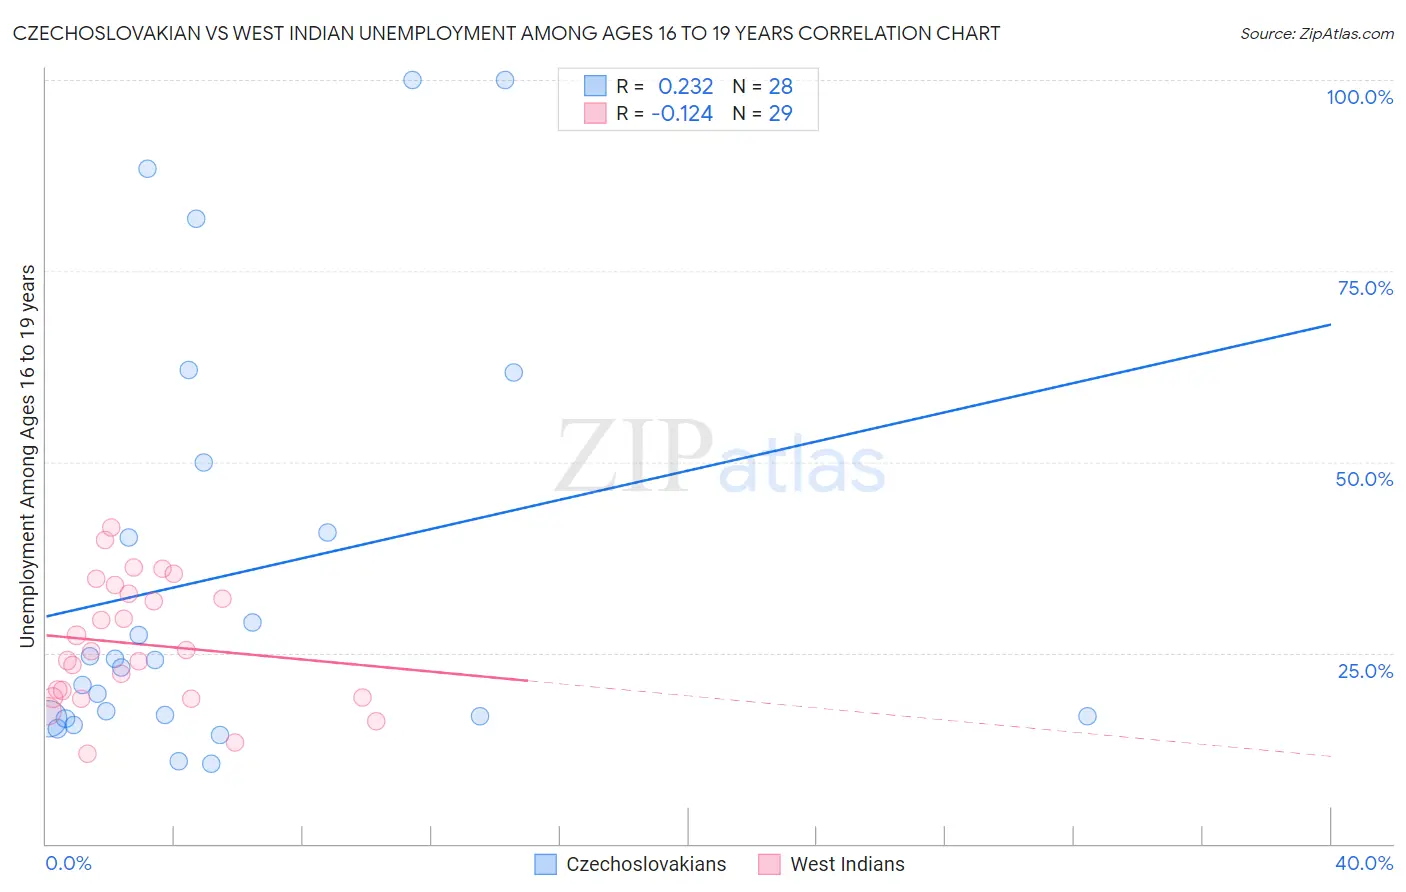
Czechoslovakian vs West Indian Unemployment Among Ages 16 to 19 years Correlation Chart
The statistical analysis conducted on geographies consisting of 347,771,610 people shows a weak positive correlation between the proportion of Czechoslovakians and unemployment rate among population between the ages 16 and 19 in the United States with a correlation coefficient (R) of 0.232 and weighted average of 16.5%. Similarly, the statistical analysis conducted on geographies consisting of 246,291,481 people shows a poor negative correlation between the proportion of West Indians and unemployment rate among population between the ages 16 and 19 in the United States with a correlation coefficient (R) of -0.124 and weighted average of 22.4%, a difference of 36.3%.
Unemployment Among Ages 16 to 19 years Correlation Summary
| Measurement | Czechoslovakian | West Indian |
| Minimum | 10.5% | 11.7% |
| Maximum | 100.0% | 41.3% |
| Range | 89.5% | 29.6% |
| Mean | 35.1% | 26.2% |
| Median | 23.5% | 25.2% |
| Interquartile 25% (IQ1) | 16.6% | 19.1% |
| Interquartile 75% (IQ3) | 45.4% | 33.3% |
| Interquartile Range (IQR) | 28.8% | 14.2% |
| Standard Deviation (Sample) | 27.6% | 8.1% |
| Standard Deviation (Population) | 27.1% | 7.9% |
Similar Demographics by Unemployment Among Ages 16 to 19 years
Demographics Similar to Czechoslovakians by Unemployment Among Ages 16 to 19 years
In terms of unemployment among ages 16 to 19 years, the demographic groups most similar to Czechoslovakians are British (16.5%, a difference of 0.020%), Sri Lankan (16.5%, a difference of 0.020%), Slovene (16.4%, a difference of 0.080%), Welsh (16.4%, a difference of 0.16%), and Lebanese (16.4%, a difference of 0.19%).
| Demographics | Rating | Rank | Unemployment Among Ages 16 to 19 years |
| Maltese | 99.7 /100 | #48 | Exceptional 16.4% |
| Iraqis | 99.7 /100 | #49 | Exceptional 16.4% |
| Bhutanese | 99.6 /100 | #50 | Exceptional 16.4% |
| Lebanese | 99.6 /100 | #51 | Exceptional 16.4% |
| Welsh | 99.6 /100 | #52 | Exceptional 16.4% |
| Slovenes | 99.6 /100 | #53 | Exceptional 16.4% |
| British | 99.5 /100 | #54 | Exceptional 16.5% |
| Czechoslovakians | 99.5 /100 | #55 | Exceptional 16.5% |
| Sri Lankans | 99.5 /100 | #56 | Exceptional 16.5% |
| Immigrants | Jordan | 99.4 /100 | #57 | Exceptional 16.5% |
| Immigrants | Uganda | 99.4 /100 | #58 | Exceptional 16.5% |
| Irish | 99.4 /100 | #59 | Exceptional 16.5% |
| Menominee | 99.3 /100 | #60 | Exceptional 16.6% |
| Immigrants | Cuba | 99.2 /100 | #61 | Exceptional 16.6% |
| Macedonians | 99.2 /100 | #62 | Exceptional 16.6% |
Demographics Similar to West Indians by Unemployment Among Ages 16 to 19 years
In terms of unemployment among ages 16 to 19 years, the demographic groups most similar to West Indians are Barbadian (22.5%, a difference of 0.14%), Yakama (22.5%, a difference of 0.36%), Cheyenne (22.3%, a difference of 0.70%), Immigrants from Armenia (22.6%, a difference of 0.81%), and Immigrants from West Indies (22.2%, a difference of 0.92%).
| Demographics | Rating | Rank | Unemployment Among Ages 16 to 19 years |
| Alaska Natives | 0.0 /100 | #314 | Tragic 21.8% |
| Immigrants | Dominica | 0.0 /100 | #315 | Tragic 21.9% |
| Tohono O'odham | 0.0 /100 | #316 | Tragic 22.1% |
| Immigrants | Belize | 0.0 /100 | #317 | Tragic 22.2% |
| Immigrants | Jamaica | 0.0 /100 | #318 | Tragic 22.2% |
| Immigrants | West Indies | 0.0 /100 | #319 | Tragic 22.2% |
| Cheyenne | 0.0 /100 | #320 | Tragic 22.3% |
| West Indians | 0.0 /100 | #321 | Tragic 22.4% |
| Barbadians | 0.0 /100 | #322 | Tragic 22.5% |
| Yakama | 0.0 /100 | #323 | Tragic 22.5% |
| Immigrants | Armenia | 0.0 /100 | #324 | Tragic 22.6% |
| Trinidadians and Tobagonians | 0.0 /100 | #325 | Tragic 22.6% |
| Immigrants | Trinidad and Tobago | 0.0 /100 | #326 | Tragic 23.1% |
| Pima | 0.0 /100 | #327 | Tragic 23.1% |
| Immigrants | Dominican Republic | 0.0 /100 | #328 | Tragic 23.3% |