Czechoslovakian vs Immigrants from North America Unemployment Among Ages 16 to 19 years

COMPARE

Czechoslovakian
Race
Ancestry
AfghanAfricanAlaska NativeAlaskan AthabascanAlbanianAleutAlsatianAmericanApacheArabArapahoArgentineanArmenianAssyrian/Chaldean/SyriacAustralianAustrianBahamianBangladeshiBarbadianBasqueBelgianBelizeanBermudanBhutaneseBlackfeetBolivianBrazilianBritishBritish West IndianBulgarianBurmeseCajunCambodianCanadianCape VerdeanCarpatho RusynCelticCentral AmericanCentral American IndianCherokeeCheyenneChickasawChileanChineseChippewaChoctawColombianColvilleComancheCosta RicanCreeCreekCroatianCrowCubanCypriotCzechCzechoslovakianDanishDelawareDominicanDutchDutch West IndianEastern EuropeanEcuadorianEgyptianEnglishEstonianEthiopianEuropeanFijianFilipinoFinnishFrenchFrench American IndianFrench CanadianGermanGerman RussianGhanaianGreekGuamanian/ChamorroGuatemalanGuyaneseHaitianHmongHonduranHopiHoumaHungarianIcelanderIndian (Asian)IndonesianInupiatIranianIraqiIrishIroquoisIsraeliItalianJamaicanJapaneseJordanianKenyanKiowaKoreanLaotianLatvianLebaneseLiberianLithuanianLumbeeLuxembourgerMacedonianMalaysianMalteseMarshalleseMenomineeMexicanMexican American IndianMongolianMoroccanNative HawaiianNavajoNepaleseNew ZealanderNicaraguanNigerianNorthern EuropeanNorwegianOkinawanOsageOttawaPaiutePakistaniPalestinianPanamanianParaguayanPennsylvania GermanPeruvianPimaPolishPortuguesePotawatomiPuebloPuerto RicanPuget Sound SalishRomanianRussianSalvadoranSamoanScandinavianScotch-IrishScottishSeminoleSenegaleseSerbianShoshoneSierra LeoneanSiouxSlavicSlovakSloveneSomaliSouth AfricanSouth AmericanSouth American IndianSoviet UnionSpaniardSpanishSpanish AmericanSpanish American IndianSri LankanSubsaharan AfricanSudaneseSwedishSwissSyrianTaiwaneseThaiTlingit-HaidaTohono O'OdhamTonganTrinidadian and TobagonianTsimshianTurkishU.S. Virgin IslanderUgandanUkrainianUruguayanUteVenezuelanVietnameseWelshWest IndianYakamaYaquiYugoslavianYumanYup'ikZimbabwean
Immigration
NonimmigrantsImmigrantsAfghanistanAfricaAlbaniaArgentinaArmeniaAsiaAustraliaAustriaBahamasBangladeshBarbadosBelarusBelgiumBelizeBoliviaBosnia and HerzegovinaBrazilBulgariaBurma/MyanmarCabo VerdeCambodiaCameroonCanadaCaribbeanCentral AmericaChileChinaColombiaCongoCosta RicaCroatiaCubaCzechoslovakiaDenmarkDominicaDominican RepublicEastern AfricaEastern AsiaEastern EuropeEcuadorEgyptEl SalvadorEnglandEritreaEthiopiaEuropeFijiFranceGermanyGhanaGreeceGrenadaGuatemalaGuyanaHaitiHondurasHong KongHungaryIndiaIndonesiaIranIraqIrelandIsraelItalyJamaicaJapanJordanKazakhstanKenyaKoreaKuwaitLaosLatin AmericaLatviaLebanonLiberiaLithuaniaMalaysiaMexicoMicronesiaMiddle AfricaMoldovaMoroccoNepalNetherlandsNicaraguaNigeriaNorth MacedoniaNorthern AfricaNorthern EuropeNorwayOceaniaPakistanPanamaPeruPhilippinesPolandPortugalRomaniaRussiaSaudi ArabiaScotlandSenegalSerbiaSierra LeoneSingaporeSomaliaSouth AfricaSouth AmericaSouth Central AsiaSouth Eastern AsiaSouthern EuropeSpainSri LankaSt. Vincent and the GrenadinesSudanSwedenSwitzerlandSyriaTaiwanThailandTrinidad and TobagoTurkeyUgandaUkraineUruguayUzbekistanVenezuelaVietnamWest IndiesWestern AfricaWestern AsiaWestern EuropeYemenZaireZimbabweAzores
Immigrants from North America
Race
Ancestry
AfghanAfricanAlaska NativeAlaskan AthabascanAlbanianAleutAlsatianAmericanApacheArabArapahoArgentineanArmenianAssyrian/Chaldean/SyriacAustralianAustrianBahamianBangladeshiBarbadianBasqueBelgianBelizeanBermudanBhutaneseBlackfeetBolivianBrazilianBritishBritish West IndianBulgarianBurmeseCajunCambodianCanadianCape VerdeanCarpatho RusynCelticCentral AmericanCentral American IndianCherokeeCheyenneChickasawChileanChineseChippewaChoctawColombianColvilleComancheCosta RicanCreeCreekCroatianCrowCubanCypriotCzechDanishDelawareDominicanDutchDutch West IndianEastern EuropeanEcuadorianEgyptianEnglishEstonianEthiopianEuropeanFijianFilipinoFinnishFrenchFrench American IndianFrench CanadianGermanGerman RussianGhanaianGreekGuamanian/ChamorroGuatemalanGuyaneseHaitianHmongHonduranHopiHoumaHungarianIcelanderIndian (Asian)IndonesianInupiatIranianIraqiIrishIroquoisIsraeliItalianJamaicanJapaneseJordanianKenyanKiowaKoreanLaotianLatvianLebaneseLiberianLithuanianLumbeeLuxembourgerMacedonianMalaysianMalteseMarshalleseMenomineeMexicanMexican American IndianMongolianMoroccanNative HawaiianNavajoNepaleseNew ZealanderNicaraguanNigerianNorthern EuropeanNorwegianOkinawanOsageOttawaPaiutePakistaniPalestinianPanamanianParaguayanPennsylvania GermanPeruvianPimaPolishPortuguesePotawatomiPuebloPuerto RicanPuget Sound SalishRomanianRussianSalvadoranSamoanScandinavianScotch-IrishScottishSeminoleSenegaleseSerbianShoshoneSierra LeoneanSiouxSlavicSlovakSloveneSomaliSouth AfricanSouth AmericanSouth American IndianSoviet UnionSpaniardSpanishSpanish AmericanSpanish American IndianSri LankanSubsaharan AfricanSudaneseSwedishSwissSyrianTaiwaneseThaiTlingit-HaidaTohono O'OdhamTonganTrinidadian and TobagonianTsimshianTurkishU.S. Virgin IslanderUgandanUkrainianUruguayanUteVenezuelanVietnameseWelshWest IndianYakamaYaquiYugoslavianYumanYup'ikZimbabwean
Immigration
NonimmigrantsImmigrantsAfghanistanAfricaAlbaniaArgentinaArmeniaAsiaAustraliaAustriaBahamasBangladeshBarbadosBelarusBelgiumBelizeBoliviaBosnia and HerzegovinaBrazilBulgariaBurma/MyanmarCabo VerdeCambodiaCameroonCanadaCaribbeanCentral AmericaChileChinaColombiaCongoCosta RicaCroatiaCubaCzechoslovakiaDenmarkDominicaDominican RepublicEastern AfricaEastern AsiaEastern EuropeEcuadorEgyptEl SalvadorEnglandEritreaEthiopiaEuropeFijiFranceGermanyGhanaGreeceGrenadaGuatemalaGuyanaHaitiHondurasHong KongHungaryIndiaIndonesiaIranIraqIrelandIsraelItalyJamaicaJapanJordanKazakhstanKenyaKoreaKuwaitLaosLatin AmericaLatviaLebanonLiberiaLithuaniaMalaysiaMexicoMicronesiaMiddle AfricaMoldovaMoroccoNepalNetherlandsNicaraguaNigeriaNorth AmericaNorth MacedoniaNorthern AfricaNorthern EuropeNorwayOceaniaPakistanPanamaPeruPhilippinesPolandPortugalRomaniaRussiaSaudi ArabiaScotlandSenegalSerbiaSierra LeoneSingaporeSomaliaSouth AfricaSouth AmericaSouth Central AsiaSouth Eastern AsiaSouthern EuropeSpainSri LankaSt. Vincent and the GrenadinesSudanSwedenSwitzerlandSyriaTaiwanThailandTrinidad and TobagoTurkeyUgandaUkraineUruguayUzbekistanVenezuelaVietnamWest IndiesWestern AfricaWestern AsiaWestern EuropeYemenZaireZimbabweAzores
Unemployment Among Ages 16 to 19 years
Income
Poverty
Unemployment
Labor Participation
Family Structure
Vehicle Availability
Education Level
Disability

Unemployment Among Ages 16 to 19 years Comparison

Czechoslovakians

Immigrants from North America

Exceptional
Exceptional
16.5%
UNEMPLOYMENT AMONG AGES 16 TO 19 YEARS
99.5/ 100
METRIC RATING
55th/ 347
METRIC RANK
16.8%
UNEMPLOYMENT AMONG AGES 16 TO 19 YEARS
97.9/ 100
METRIC RATING
76th/ 347
METRIC RANK

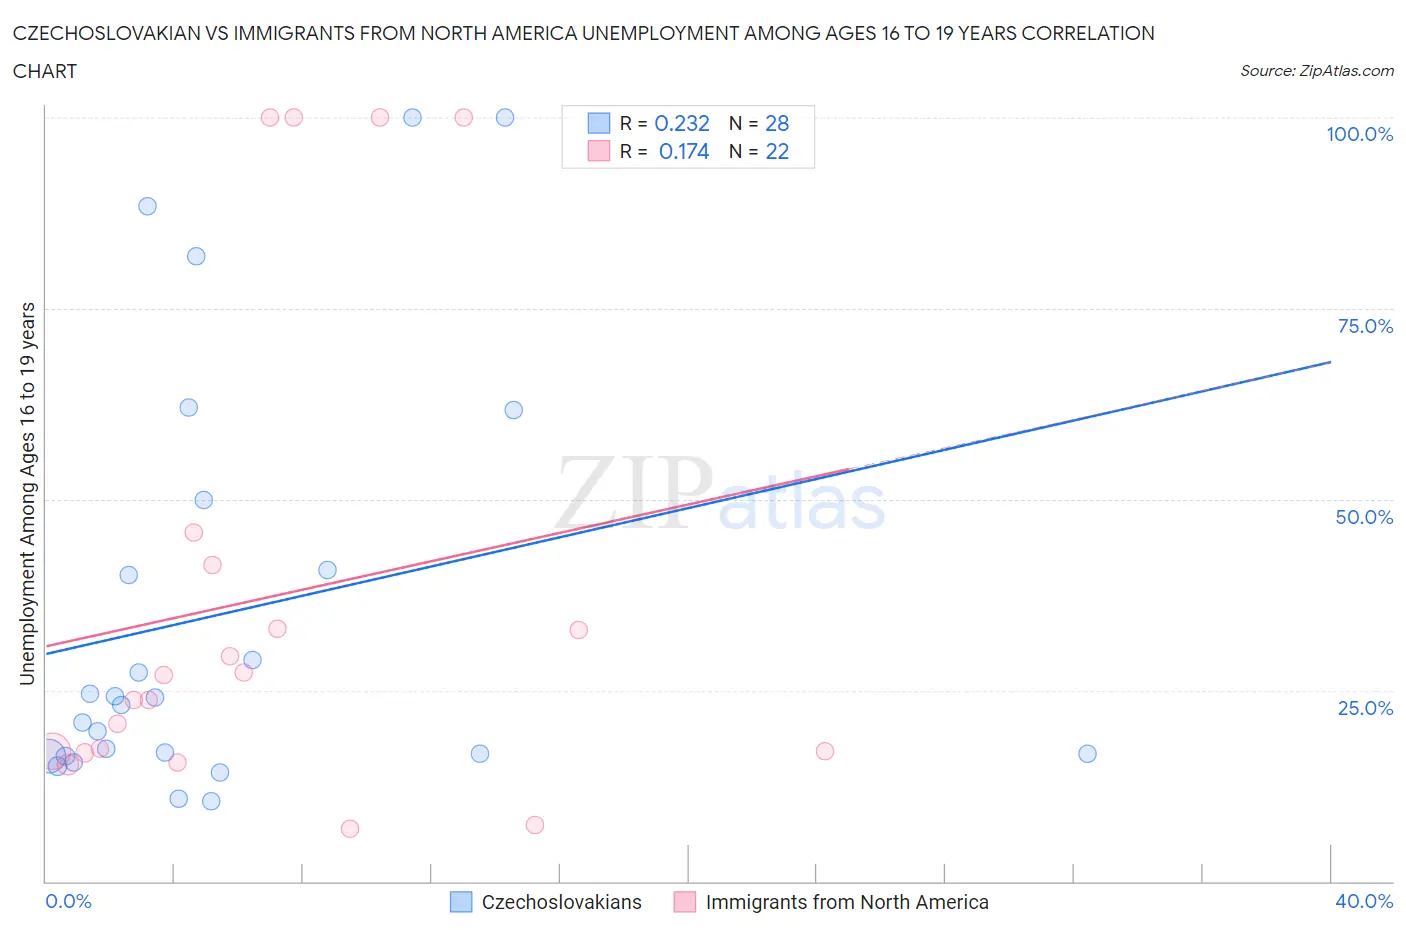
Czechoslovakian vs Immigrants from North America Unemployment Among Ages 16 to 19 years Correlation Chart

The statistical analysis conducted on geographies consisting of 347,771,610 people shows a weak positive correlation between the proportion of Czechoslovakians and unemployment rate among population between the ages 16 and 19 in the United States with a correlation coefficient (R) of 0.232 and weighted average of 16.5%. Similarly, the statistical analysis conducted on geographies consisting of 431,170,215 people shows a poor positive correlation between the proportion of Immigrants from North America and unemployment rate among population between the ages 16 and 19 in the United States with a correlation coefficient (R) of 0.174 and weighted average of 16.8%, a difference of 1.9%.
Czechoslovakian vs Immigrants from North America Unemployment Among Ages 16 to 19 years

Unemployment Among Ages 16 to 19 years Correlation Summary

MeasurementCzechoslovakianImmigrants from North America
Minimum10.5%6.9%
Maximum100.0%100.0%
Range89.5%93.1%
Mean35.1%37.2%
Median23.5%25.4%
Interquartile 25% (IQ1)16.6%17.0%
Interquartile 75% (IQ3)45.4%41.4%
Interquartile Range (IQR)28.8%24.4%
Standard Deviation (Sample)27.6%31.8%
Standard Deviation (Population)27.1%31.0%

Similar Demographics by Unemployment Among Ages 16 to 19 years

Demographics Similar to Czechoslovakians by Unemployment Among Ages 16 to 19 years

In terms of unemployment among ages 16 to 19 years, the demographic groups most similar to Czechoslovakians are British (16.5%, a difference of 0.020%), Sri Lankan (16.5%, a difference of 0.020%), Slovene (16.4%, a difference of 0.080%), Welsh (16.4%, a difference of 0.16%), and Lebanese (16.4%, a difference of 0.19%).
DemographicsRating | RankUnemployment Among Ages 16 to 19 years
Maltese
99.7
/100
|
#48
Exceptional
16.4%
Iraqis
99.7
/100
|
#49
Exceptional
16.4%
Bhutanese
99.6
/100
|
#50
Exceptional
16.4%
Lebanese
99.6
/100
|
#51
Exceptional
16.4%
Welsh
99.6
/100
|
#52
Exceptional
16.4%
Slovenes
99.6
/100
|
#53
Exceptional
16.4%
British
99.5
/100
|
#54
Exceptional
16.5%
Czechoslovakians
99.5
/100
|
#55
Exceptional
16.5%
Sri Lankans
99.5
/100
|
#56
Exceptional
16.5%
Immigrants | Jordan
99.4
/100
|
#57
Exceptional
16.5%
Immigrants | Uganda
99.4
/100
|
#58
Exceptional
16.5%
Irish
99.4
/100
|
#59
Exceptional
16.5%
Menominee
99.3
/100
|
#60
Exceptional
16.6%
Immigrants | Cuba
99.2
/100
|
#61
Exceptional
16.6%
Macedonians
99.2
/100
|
#62
Exceptional
16.6%

Demographics Similar to Immigrants from North America by Unemployment Among Ages 16 to 19 years

In terms of unemployment among ages 16 to 19 years, the demographic groups most similar to Immigrants from North America are New Zealander (16.8%, a difference of 0.070%), Immigrants from Singapore (16.8%, a difference of 0.070%), Soviet Union (16.8%, a difference of 0.090%), Immigrants from Eastern Africa (16.8%, a difference of 0.13%), and Lithuanian (16.7%, a difference of 0.16%).
DemographicsRating | RankUnemployment Among Ages 16 to 19 years
Serbians
98.7
/100
|
#69
Exceptional
16.7%
Austrians
98.6
/100
|
#70
Exceptional
16.7%
Latvians
98.5
/100
|
#71
Exceptional
16.7%
Immigrants | Canada
98.5
/100
|
#72
Exceptional
16.7%
Lithuanians
98.2
/100
|
#73
Exceptional
16.7%
Immigrants | Eastern Africa
98.1
/100
|
#74
Exceptional
16.8%
New Zealanders
98.0
/100
|
#75
Exceptional
16.8%
Immigrants | North America
97.9
/100
|
#76
Exceptional
16.8%
Immigrants | Singapore
97.8
/100
|
#77
Exceptional
16.8%
Soviet Union
97.8
/100
|
#78
Exceptional
16.8%
Slovaks
97.5
/100
|
#79
Exceptional
16.8%
French Canadians
97.5
/100
|
#80
Exceptional
16.8%
Immigrants | Latvia
97.5
/100
|
#81
Exceptional
16.8%
Whites/Caucasians
97.5
/100
|
#82
Exceptional
16.8%
Ugandans
97.4
/100
|
#83
Exceptional
16.8%