Creek vs Houma Unemployment Among Ages 25 to 29 years

COMPARE

Creek
Race
Ancestry
AfghanAfricanAlaska NativeAlaskan AthabascanAlbanianAleutAlsatianAmericanApacheArabArapahoArgentineanArmenianAssyrian/Chaldean/SyriacAustralianAustrianBahamianBangladeshiBarbadianBasqueBelgianBelizeanBermudanBhutaneseBlackfeetBolivianBrazilianBritishBritish West IndianBulgarianBurmeseCajunCambodianCanadianCape VerdeanCarpatho RusynCelticCentral AmericanCentral American IndianCherokeeCheyenneChickasawChileanChineseChippewaChoctawColombianColvilleComancheCosta RicanCreeCreekCroatianCrowCubanCypriotCzechCzechoslovakianDanishDelawareDominicanDutchDutch West IndianEastern EuropeanEcuadorianEgyptianEnglishEstonianEthiopianEuropeanFijianFilipinoFinnishFrenchFrench American IndianFrench CanadianGermanGerman RussianGhanaianGreekGuamanian/ChamorroGuatemalanGuyaneseHaitianHmongHonduranHopiHungarianIcelanderIndian (Asian)IndonesianInupiatIranianIraqiIrishIroquoisIsraeliItalianJamaicanJapaneseJordanianKenyanKiowaKoreanLaotianLatvianLebaneseLiberianLithuanianLumbeeLuxembourgerMacedonianMalaysianMalteseMarshalleseMenomineeMexicanMexican American IndianMongolianMoroccanNative HawaiianNavajoNepaleseNew ZealanderNicaraguanNigerianNorthern EuropeanNorwegianOkinawanOsageOttawaPaiutePakistaniPalestinianPanamanianParaguayanPennsylvania GermanPeruvianPimaPolishPortuguesePotawatomiPuebloPuerto RicanPuget Sound SalishRomanianRussianSalvadoranSamoanScandinavianScotch-IrishScottishSeminoleSenegaleseSerbianShoshoneSierra LeoneanSiouxSlavicSlovakSloveneSomaliSouth AfricanSouth AmericanSouth American IndianSoviet UnionSpaniardSpanishSpanish AmericanSpanish American IndianSri LankanSubsaharan AfricanSudaneseSwedishSwissSyrianTaiwaneseThaiTlingit-HaidaTohono O'OdhamTonganTrinidadian and TobagonianTsimshianTurkishU.S. Virgin IslanderUgandanUkrainianUruguayanUteVenezuelanVietnameseWelshWest IndianYakamaYaquiYugoslavianYumanYup'ikZimbabwean
Immigration
NonimmigrantsImmigrantsAfghanistanAfricaAlbaniaArgentinaArmeniaAsiaAustraliaAustriaBahamasBangladeshBarbadosBelarusBelgiumBelizeBoliviaBosnia and HerzegovinaBrazilBulgariaBurma/MyanmarCabo VerdeCambodiaCameroonCanadaCaribbeanCentral AmericaChileChinaColombiaCongoCosta RicaCroatiaCubaCzechoslovakiaDenmarkDominicaDominican RepublicEastern AfricaEastern AsiaEastern EuropeEcuadorEgyptEl SalvadorEnglandEritreaEthiopiaEuropeFijiFranceGermanyGhanaGreeceGrenadaGuatemalaGuyanaHaitiHondurasHong KongHungaryIndiaIndonesiaIranIraqIrelandIsraelItalyJamaicaJapanJordanKazakhstanKenyaKoreaKuwaitLaosLatin AmericaLatviaLebanonLiberiaLithuaniaMalaysiaMexicoMicronesiaMiddle AfricaMoldovaMoroccoNepalNetherlandsNicaraguaNigeriaNorth AmericaNorth MacedoniaNorthern AfricaNorthern EuropeNorwayOceaniaPakistanPanamaPeruPhilippinesPolandPortugalRomaniaRussiaSaudi ArabiaScotlandSenegalSerbiaSierra LeoneSingaporeSomaliaSouth AfricaSouth AmericaSouth Central AsiaSouth Eastern AsiaSouthern EuropeSpainSri LankaSt. Vincent and the GrenadinesSudanSwedenSwitzerlandSyriaTaiwanThailandTrinidad and TobagoTurkeyUgandaUkraineUruguayUzbekistanVenezuelaVietnamWest IndiesWestern AfricaWestern AsiaWestern EuropeYemenZaireZimbabweAzores
Houma
Race
Ancestry
AfghanAfricanAlaska NativeAlaskan AthabascanAlbanianAleutAlsatianAmericanApacheArabArapahoArgentineanArmenianAssyrian/Chaldean/SyriacAustralianAustrianBahamianBangladeshiBarbadianBasqueBelgianBelizeanBermudanBhutaneseBlackfeetBolivianBrazilianBritishBritish West IndianBulgarianBurmeseCajunCambodianCanadianCape VerdeanCarpatho RusynCelticCentral AmericanCentral American IndianCherokeeCheyenneChickasawChileanChineseChippewaChoctawColombianColvilleComancheCosta RicanCreeCroatianCrowCubanCypriotCzechCzechoslovakianDanishDelawareDominicanDutchDutch West IndianEastern EuropeanEcuadorianEgyptianEnglishEstonianEthiopianEuropeanFijianFilipinoFinnishFrenchFrench American IndianFrench CanadianGermanGerman RussianGhanaianGreekGuamanian/ChamorroGuatemalanGuyaneseHaitianHmongHonduranHopiHoumaHungarianIcelanderIndian (Asian)IndonesianInupiatIranianIraqiIrishIroquoisIsraeliItalianJamaicanJapaneseJordanianKenyanKiowaKoreanLaotianLatvianLebaneseLiberianLithuanianLumbeeLuxembourgerMacedonianMalaysianMalteseMarshalleseMenomineeMexicanMexican American IndianMongolianMoroccanNative HawaiianNavajoNepaleseNew ZealanderNicaraguanNigerianNorthern EuropeanNorwegianOkinawanOsageOttawaPaiutePakistaniPalestinianPanamanianParaguayanPennsylvania GermanPeruvianPimaPolishPortuguesePotawatomiPuebloPuerto RicanPuget Sound SalishRomanianRussianSalvadoranSamoanScandinavianScotch-IrishScottishSeminoleSenegaleseSerbianShoshoneSierra LeoneanSiouxSlavicSlovakSloveneSomaliSouth AfricanSouth AmericanSouth American IndianSoviet UnionSpaniardSpanishSpanish AmericanSpanish American IndianSri LankanSubsaharan AfricanSudaneseSwedishSwissSyrianTaiwaneseThaiTlingit-HaidaTohono O'OdhamTonganTrinidadian and TobagonianTsimshianTurkishU.S. Virgin IslanderUgandanUkrainianUruguayanUteVenezuelanVietnameseWelshWest IndianYakamaYaquiYugoslavianYumanYup'ikZimbabwean
Immigration
NonimmigrantsImmigrantsAfghanistanAfricaAlbaniaArgentinaArmeniaAsiaAustraliaAustriaBahamasBangladeshBarbadosBelarusBelgiumBelizeBoliviaBosnia and HerzegovinaBrazilBulgariaBurma/MyanmarCabo VerdeCambodiaCameroonCanadaCaribbeanCentral AmericaChileChinaColombiaCongoCosta RicaCroatiaCubaCzechoslovakiaDenmarkDominicaDominican RepublicEastern AfricaEastern AsiaEastern EuropeEcuadorEgyptEl SalvadorEnglandEritreaEthiopiaEuropeFijiFranceGermanyGhanaGreeceGrenadaGuatemalaGuyanaHaitiHondurasHong KongHungaryIndiaIndonesiaIranIraqIrelandIsraelItalyJamaicaJapanJordanKazakhstanKenyaKoreaKuwaitLaosLatin AmericaLatviaLebanonLiberiaLithuaniaMalaysiaMexicoMicronesiaMiddle AfricaMoldovaMoroccoNepalNetherlandsNicaraguaNigeriaNorth AmericaNorth MacedoniaNorthern AfricaNorthern EuropeNorwayOceaniaPakistanPanamaPeruPhilippinesPolandPortugalRomaniaRussiaSaudi ArabiaScotlandSenegalSerbiaSierra LeoneSingaporeSomaliaSouth AfricaSouth AmericaSouth Central AsiaSouth Eastern AsiaSouthern EuropeSpainSri LankaSt. Vincent and the GrenadinesSudanSwedenSwitzerlandSyriaTaiwanThailandTrinidad and TobagoTurkeyUgandaUkraineUruguayUzbekistanVenezuelaVietnamWest IndiesWestern AfricaWestern AsiaWestern EuropeYemenZaireZimbabweAzores
Unemployment Among Ages 25 to 29 years
Income
Poverty
Unemployment
Labor Participation
Family Structure
Vehicle Availability
Education Level
Disability

Unemployment Among Ages 25 to 29 years Comparison

Creek

Houma

Tragic
Tragic
7.6%
UNEMPLOYMENT AMONG AGES 25 TO 29 YEARS
0.0/ 100
METRIC RATING
283rd/ 347
METRIC RANK
8.7%
UNEMPLOYMENT AMONG AGES 25 TO 29 YEARS
0.0/ 100
METRIC RATING
324th/ 347
METRIC RANK

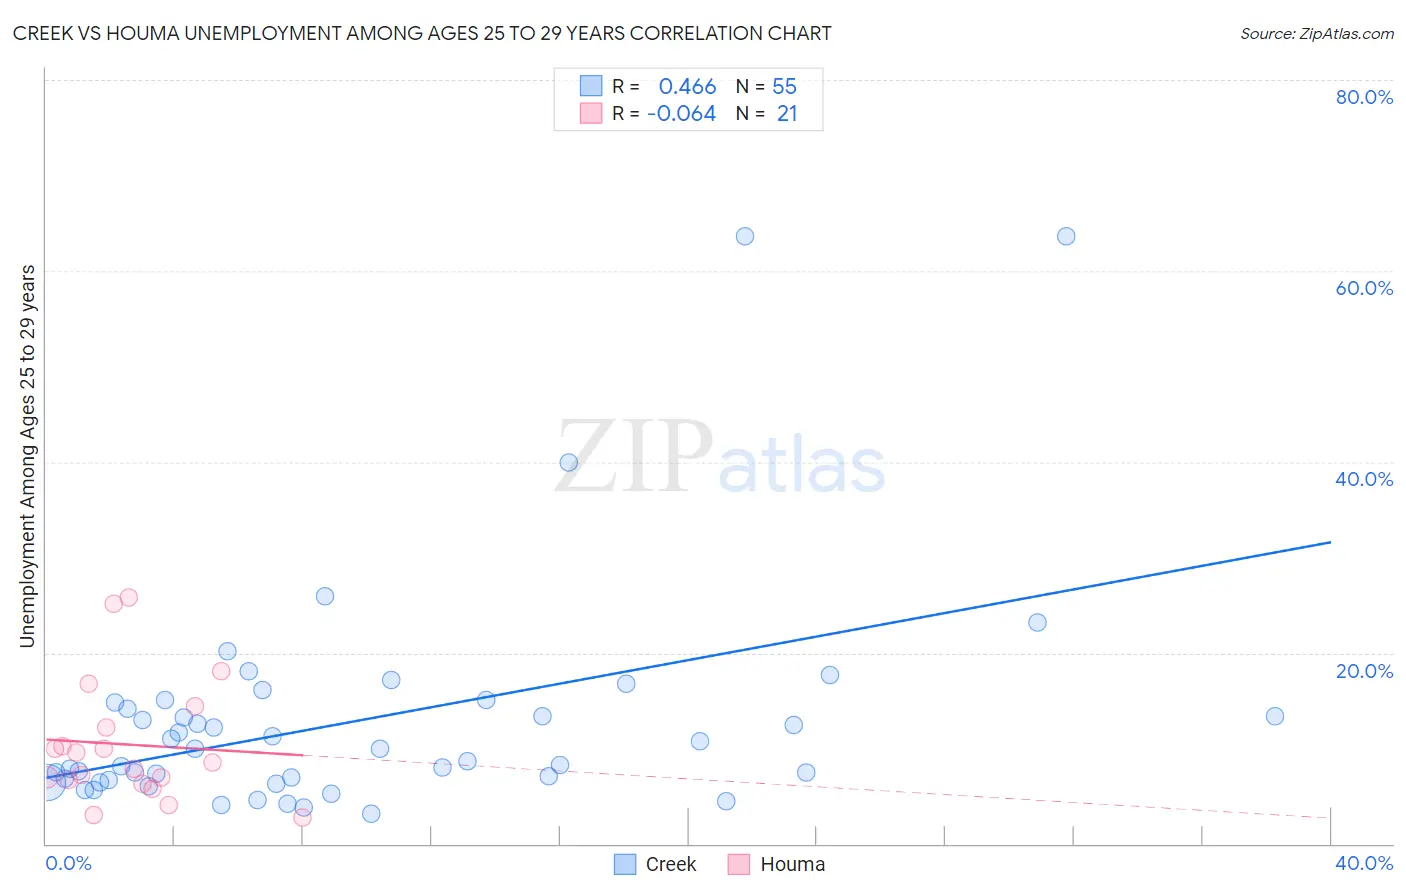
Creek vs Houma Unemployment Among Ages 25 to 29 years Correlation Chart

The statistical analysis conducted on geographies consisting of 172,938,498 people shows a moderate positive correlation between the proportion of Creek and unemployment rate among population between the ages 25 and 29 in the United States with a correlation coefficient (R) of 0.466 and weighted average of 7.6%. Similarly, the statistical analysis conducted on geographies consisting of 36,263,529 people shows a slight negative correlation between the proportion of Houma and unemployment rate among population between the ages 25 and 29 in the United States with a correlation coefficient (R) of -0.064 and weighted average of 8.7%, a difference of 15.1%.
Creek vs Houma Unemployment Among Ages 25 to 29 years

Unemployment Among Ages 25 to 29 years Correlation Summary

MeasurementCreekHouma
Minimum3.2%2.8%
Maximum63.6%25.8%
Range60.4%23.0%
Mean12.9%10.4%
Median10.0%8.5%
Interquartile 25% (IQ1)6.7%6.5%
Interquartile 75% (IQ3)14.8%13.3%
Interquartile Range (IQR)8.1%6.8%
Standard Deviation (Sample)11.8%6.4%
Standard Deviation (Population)11.7%6.3%

Similar Demographics by Unemployment Among Ages 25 to 29 years

Demographics Similar to Creek by Unemployment Among Ages 25 to 29 years

In terms of unemployment among ages 25 to 29 years, the demographic groups most similar to Creek are Cherokee (7.6%, a difference of 0.010%), Senegalese (7.6%, a difference of 0.13%), Immigrants from Senegal (7.6%, a difference of 0.17%), Vietnamese (7.6%, a difference of 0.22%), and Immigrants from Bangladesh (7.5%, a difference of 0.34%).
DemographicsRating | RankUnemployment Among Ages 25 to 29 years
French American Indians
0.0
/100
|
#276
Tragic
7.5%
Iroquois
0.0
/100
|
#277
Tragic
7.5%
Mexicans
0.0
/100
|
#278
Tragic
7.5%
Nepalese
0.0
/100
|
#279
Tragic
7.5%
Immigrants | Caribbean
0.0
/100
|
#280
Tragic
7.5%
Immigrants | Bangladesh
0.0
/100
|
#281
Tragic
7.5%
Immigrants | Senegal
0.0
/100
|
#282
Tragic
7.6%
Creek
0.0
/100
|
#283
Tragic
7.6%
Cherokee
0.0
/100
|
#284
Tragic
7.6%
Senegalese
0.0
/100
|
#285
Tragic
7.6%
Vietnamese
0.0
/100
|
#286
Tragic
7.6%
Immigrants | Mexico
0.0
/100
|
#287
Tragic
7.6%
Africans
0.0
/100
|
#288
Tragic
7.6%
Belizeans
0.0
/100
|
#289
Tragic
7.7%
Armenians
0.0
/100
|
#290
Tragic
7.7%

Demographics Similar to Houma by Unemployment Among Ages 25 to 29 years

In terms of unemployment among ages 25 to 29 years, the demographic groups most similar to Houma are Dominican (8.7%, a difference of 0.36%), Tlingit-Haida (8.7%, a difference of 0.45%), Yakama (8.8%, a difference of 0.51%), Immigrants from Dominican Republic (8.6%, a difference of 1.2%), and Black/African American (8.6%, a difference of 1.9%).
DemographicsRating | RankUnemployment Among Ages 25 to 29 years
Immigrants | Guyana
0.0
/100
|
#317
Tragic
8.5%
Guyanese
0.0
/100
|
#318
Tragic
8.5%
Immigrants | Armenia
0.0
/100
|
#319
Tragic
8.5%
Blacks/African Americans
0.0
/100
|
#320
Tragic
8.6%
Immigrants | Dominican Republic
0.0
/100
|
#321
Tragic
8.6%
Tlingit-Haida
0.0
/100
|
#322
Tragic
8.7%
Dominicans
0.0
/100
|
#323
Tragic
8.7%
Houma
0.0
/100
|
#324
Tragic
8.7%
Yakama
0.0
/100
|
#325
Tragic
8.8%
Shoshone
0.0
/100
|
#326
Tragic
9.2%
Colville
0.0
/100
|
#327
Tragic
9.2%
Apache
0.0
/100
|
#328
Tragic
9.5%
Aleuts
0.0
/100
|
#329
Tragic
9.7%
Natives/Alaskans
0.0
/100
|
#330
Tragic
9.8%
Alaska Natives
0.0
/100
|
#331
Tragic
10.2%