Cree vs Slovene Unemployment Among Ages 30 to 34 years

COMPARE

Cree
Race
Ancestry
AfghanAfricanAlaska NativeAlaskan AthabascanAlbanianAleutAlsatianAmericanApacheArabArapahoArgentineanArmenianAssyrian/Chaldean/SyriacAustralianAustrianBahamianBangladeshiBarbadianBasqueBelgianBelizeanBermudanBhutaneseBlackfeetBolivianBrazilianBritishBritish West IndianBulgarianBurmeseCajunCambodianCanadianCape VerdeanCarpatho RusynCelticCentral AmericanCentral American IndianCherokeeCheyenneChickasawChileanChineseChippewaChoctawColombianColvilleComancheCosta RicanCreeCreekCroatianCrowCubanCypriotCzechCzechoslovakianDanishDelawareDominicanDutchDutch West IndianEastern EuropeanEcuadorianEgyptianEnglishEstonianEthiopianEuropeanFijianFilipinoFinnishFrenchFrench American IndianFrench CanadianGermanGerman RussianGhanaianGreekGuamanian/ChamorroGuatemalanGuyaneseHaitianHmongHonduranHopiHoumaHungarianIcelanderIndian (Asian)IndonesianInupiatIranianIraqiIrishIroquoisIsraeliItalianJamaicanJapaneseJordanianKenyanKiowaKoreanLaotianLatvianLebaneseLiberianLithuanianLumbeeLuxembourgerMacedonianMalaysianMalteseMarshalleseMenomineeMexicanMexican American IndianMongolianMoroccanNative HawaiianNavajoNepaleseNew ZealanderNicaraguanNigerianNorthern EuropeanNorwegianOkinawanOsageOttawaPaiutePakistaniPalestinianPanamanianParaguayanPennsylvania GermanPeruvianPimaPolishPortuguesePotawatomiPuebloPuerto RicanPuget Sound SalishRomanianRussianSalvadoranSamoanScandinavianScotch-IrishScottishSeminoleSenegaleseSerbianShoshoneSierra LeoneanSiouxSlavicSlovakSomaliSouth AfricanSouth AmericanSouth American IndianSoviet UnionSpaniardSpanishSpanish AmericanSpanish American IndianSri LankanSubsaharan AfricanSudaneseSwedishSwissSyrianTaiwaneseThaiTlingit-HaidaTohono O'OdhamTonganTrinidadian and TobagonianTsimshianTurkishU.S. Virgin IslanderUgandanUkrainianUruguayanUteVenezuelanVietnameseWelshWest IndianYakamaYaquiYugoslavianYumanYup'ikZimbabwean
Immigration
NonimmigrantsImmigrantsAfghanistanAfricaAlbaniaArgentinaArmeniaAsiaAustraliaAustriaBahamasBangladeshBarbadosBelarusBelgiumBelizeBoliviaBosnia and HerzegovinaBrazilBulgariaBurma/MyanmarCabo VerdeCambodiaCameroonCanadaCaribbeanCentral AmericaChileChinaColombiaCongoCosta RicaCroatiaCubaCzechoslovakiaDenmarkDominicaDominican RepublicEastern AfricaEastern AsiaEastern EuropeEcuadorEgyptEl SalvadorEnglandEritreaEthiopiaEuropeFijiFranceGermanyGhanaGreeceGrenadaGuatemalaGuyanaHaitiHondurasHong KongHungaryIndiaIndonesiaIranIraqIrelandIsraelItalyJamaicaJapanJordanKazakhstanKenyaKoreaKuwaitLaosLatin AmericaLatviaLebanonLiberiaLithuaniaMalaysiaMexicoMicronesiaMiddle AfricaMoldovaMoroccoNepalNetherlandsNicaraguaNigeriaNorth AmericaNorth MacedoniaNorthern AfricaNorthern EuropeNorwayOceaniaPakistanPanamaPeruPhilippinesPolandPortugalRomaniaRussiaSaudi ArabiaScotlandSenegalSerbiaSierra LeoneSingaporeSomaliaSouth AfricaSouth AmericaSouth Central AsiaSouth Eastern AsiaSouthern EuropeSpainSri LankaSt. Vincent and the GrenadinesSudanSwedenSwitzerlandSyriaTaiwanThailandTrinidad and TobagoTurkeyUgandaUkraineUruguayUzbekistanVenezuelaVietnamWest IndiesWestern AfricaWestern AsiaWestern EuropeYemenZaireZimbabweAzores
Slovene
Race
Ancestry
AfghanAfricanAlaska NativeAlaskan AthabascanAlbanianAleutAlsatianAmericanApacheArabArapahoArgentineanArmenianAssyrian/Chaldean/SyriacAustralianAustrianBahamianBangladeshiBarbadianBasqueBelgianBelizeanBermudanBhutaneseBlackfeetBolivianBrazilianBritishBritish West IndianBulgarianBurmeseCajunCambodianCanadianCape VerdeanCarpatho RusynCelticCentral AmericanCentral American IndianCherokeeCheyenneChickasawChileanChineseChippewaChoctawColombianColvilleComancheCosta RicanCreekCroatianCrowCubanCypriotCzechCzechoslovakianDanishDelawareDominicanDutchDutch West IndianEastern EuropeanEcuadorianEgyptianEnglishEstonianEthiopianEuropeanFijianFilipinoFinnishFrenchFrench American IndianFrench CanadianGermanGerman RussianGhanaianGreekGuamanian/ChamorroGuatemalanGuyaneseHaitianHmongHonduranHopiHoumaHungarianIcelanderIndian (Asian)IndonesianInupiatIranianIraqiIrishIroquoisIsraeliItalianJamaicanJapaneseJordanianKenyanKiowaKoreanLaotianLatvianLebaneseLiberianLithuanianLumbeeLuxembourgerMacedonianMalaysianMalteseMarshalleseMenomineeMexicanMexican American IndianMongolianMoroccanNative HawaiianNavajoNepaleseNew ZealanderNicaraguanNigerianNorthern EuropeanNorwegianOkinawanOsageOttawaPaiutePakistaniPalestinianPanamanianParaguayanPennsylvania GermanPeruvianPimaPolishPortuguesePotawatomiPuebloPuerto RicanPuget Sound SalishRomanianRussianSalvadoranSamoanScandinavianScotch-IrishScottishSeminoleSenegaleseSerbianShoshoneSierra LeoneanSiouxSlavicSlovakSloveneSomaliSouth AfricanSouth AmericanSouth American IndianSoviet UnionSpaniardSpanishSpanish AmericanSpanish American IndianSri LankanSubsaharan AfricanSudaneseSwedishSwissSyrianTaiwaneseThaiTlingit-HaidaTohono O'OdhamTonganTrinidadian and TobagonianTsimshianTurkishU.S. Virgin IslanderUgandanUkrainianUruguayanUteVenezuelanVietnameseWelshWest IndianYakamaYaquiYugoslavianYumanYup'ikZimbabwean
Immigration
NonimmigrantsImmigrantsAfghanistanAfricaAlbaniaArgentinaArmeniaAsiaAustraliaAustriaBahamasBangladeshBarbadosBelarusBelgiumBelizeBoliviaBosnia and HerzegovinaBrazilBulgariaBurma/MyanmarCabo VerdeCambodiaCameroonCanadaCaribbeanCentral AmericaChileChinaColombiaCongoCosta RicaCroatiaCubaCzechoslovakiaDenmarkDominicaDominican RepublicEastern AfricaEastern AsiaEastern EuropeEcuadorEgyptEl SalvadorEnglandEritreaEthiopiaEuropeFijiFranceGermanyGhanaGreeceGrenadaGuatemalaGuyanaHaitiHondurasHong KongHungaryIndiaIndonesiaIranIraqIrelandIsraelItalyJamaicaJapanJordanKazakhstanKenyaKoreaKuwaitLaosLatin AmericaLatviaLebanonLiberiaLithuaniaMalaysiaMexicoMicronesiaMiddle AfricaMoldovaMoroccoNepalNetherlandsNicaraguaNigeriaNorth AmericaNorth MacedoniaNorthern AfricaNorthern EuropeNorwayOceaniaPakistanPanamaPeruPhilippinesPolandPortugalRomaniaRussiaSaudi ArabiaScotlandSenegalSerbiaSierra LeoneSingaporeSomaliaSouth AfricaSouth AmericaSouth Central AsiaSouth Eastern AsiaSouthern EuropeSpainSri LankaSt. Vincent and the GrenadinesSudanSwedenSwitzerlandSyriaTaiwanThailandTrinidad and TobagoTurkeyUgandaUkraineUruguayUzbekistanVenezuelaVietnamWest IndiesWestern AfricaWestern AsiaWestern EuropeYemenZaireZimbabweAzores
Unemployment Among Ages 30 to 34 years
Income
Poverty
Unemployment
Labor Participation
Family Structure
Vehicle Availability
Education Level
Disability

Unemployment Among Ages 30 to 34 years Comparison

Cree

Slovenes

Tragic
Exceptional
6.4%
UNEMPLOYMENT AMONG AGES 30 TO 34 YEARS
0.0/ 100
METRIC RATING
279th/ 347
METRIC RANK
5.2%
UNEMPLOYMENT AMONG AGES 30 TO 34 YEARS
96.2/ 100
METRIC RATING
73rd/ 347
METRIC RANK

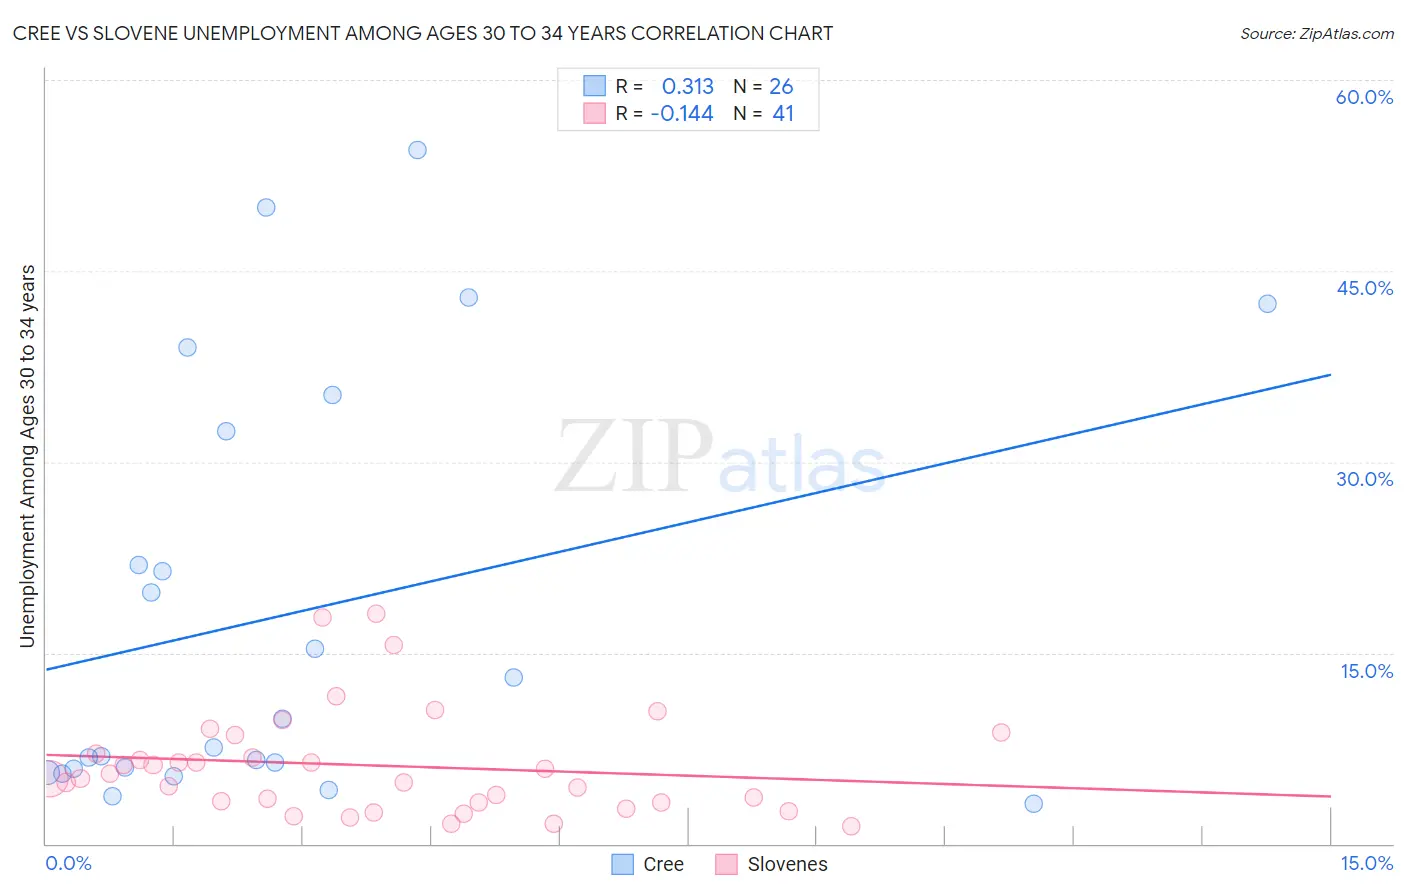
Cree vs Slovene Unemployment Among Ages 30 to 34 years Correlation Chart

The statistical analysis conducted on geographies consisting of 74,890,168 people shows a mild positive correlation between the proportion of Cree and unemployment rate among population between the ages 30 and 34 in the United States with a correlation coefficient (R) of 0.313 and weighted average of 6.4%. Similarly, the statistical analysis conducted on geographies consisting of 247,890,724 people shows a poor negative correlation between the proportion of Slovenes and unemployment rate among population between the ages 30 and 34 in the United States with a correlation coefficient (R) of -0.144 and weighted average of 5.2%, a difference of 23.5%.
Cree vs Slovene Unemployment Among Ages 30 to 34 years

Unemployment Among Ages 30 to 34 years Correlation Summary

MeasurementCreeSlovene
Minimum3.1%1.4%
Maximum54.5%18.1%
Range51.4%16.7%
Mean18.1%6.1%
Median8.7%5.1%
Interquartile 25% (IQ1)5.9%3.3%
Interquartile 75% (IQ3)32.4%7.8%
Interquartile Range (IQR)26.5%4.6%
Standard Deviation (Sample)16.3%4.1%
Standard Deviation (Population)16.0%4.0%

Similar Demographics by Unemployment Among Ages 30 to 34 years

Demographics Similar to Cree by Unemployment Among Ages 30 to 34 years

In terms of unemployment among ages 30 to 34 years, the demographic groups most similar to Cree are Cherokee (6.4%, a difference of 0.040%), Immigrants from Caribbean (6.4%, a difference of 0.37%), Osage (6.3%, a difference of 0.48%), Immigrants from Ecuador (6.3%, a difference of 0.56%), and African (6.4%, a difference of 0.74%).
DemographicsRating | RankUnemployment Among Ages 30 to 34 years
Blackfeet
0.0
/100
|
#272
Tragic
6.3%
Ottawa
0.0
/100
|
#273
Tragic
6.3%
U.S. Virgin Islanders
0.0
/100
|
#274
Tragic
6.3%
Ecuadorians
0.0
/100
|
#275
Tragic
6.3%
Pennsylvania Germans
0.0
/100
|
#276
Tragic
6.3%
Immigrants | Ecuador
0.0
/100
|
#277
Tragic
6.3%
Osage
0.0
/100
|
#278
Tragic
6.3%
Cree
0.0
/100
|
#279
Tragic
6.4%
Cherokee
0.0
/100
|
#280
Tragic
6.4%
Immigrants | Caribbean
0.0
/100
|
#281
Tragic
6.4%
Africans
0.0
/100
|
#282
Tragic
6.4%
Hispanics or Latinos
0.0
/100
|
#283
Tragic
6.4%
Immigrants | Bangladesh
0.0
/100
|
#284
Tragic
6.4%
Choctaw
0.0
/100
|
#285
Tragic
6.4%
Central American Indians
0.0
/100
|
#286
Tragic
6.4%

Demographics Similar to Slovenes by Unemployment Among Ages 30 to 34 years

In terms of unemployment among ages 30 to 34 years, the demographic groups most similar to Slovenes are Immigrants from Asia (5.2%, a difference of 0.030%), Immigrants from Moldova (5.1%, a difference of 0.090%), Iranian (5.2%, a difference of 0.090%), Paraguayan (5.1%, a difference of 0.10%), and Immigrants from Northern Africa (5.1%, a difference of 0.11%).
DemographicsRating | RankUnemployment Among Ages 30 to 34 years
Immigrants | Zimbabwe
96.7
/100
|
#66
Exceptional
5.1%
Burmese
96.5
/100
|
#67
Exceptional
5.1%
Jordanians
96.5
/100
|
#68
Exceptional
5.1%
Immigrants | Northern Africa
96.4
/100
|
#69
Exceptional
5.1%
Immigrants | Iraq
96.4
/100
|
#70
Exceptional
5.1%
Paraguayans
96.4
/100
|
#71
Exceptional
5.1%
Immigrants | Moldova
96.4
/100
|
#72
Exceptional
5.1%
Slovenes
96.2
/100
|
#73
Exceptional
5.2%
Immigrants | Asia
96.2
/100
|
#74
Exceptional
5.2%
Iranians
96.0
/100
|
#75
Exceptional
5.2%
Scandinavians
95.6
/100
|
#76
Exceptional
5.2%
Uruguayans
95.4
/100
|
#77
Exceptional
5.2%
Indonesians
95.1
/100
|
#78
Exceptional
5.2%
Immigrants | Lithuania
95.0
/100
|
#79
Exceptional
5.2%
Immigrants | Indonesia
94.7
/100
|
#80
Exceptional
5.2%