Cree vs Immigrants from Saudi Arabia Unemployment Among Ages 30 to 34 years
COMPARE
Cree
Immigrants from Saudi Arabia
Unemployment Among Ages 30 to 34 years
Unemployment Among Ages 30 to 34 years Comparison
Cree
Immigrants from Saudi Arabia
6.4%
UNEMPLOYMENT AMONG AGES 30 TO 34 YEARS
0.0/ 100
METRIC RATING
279th/ 347
METRIC RANK
5.0%
UNEMPLOYMENT AMONG AGES 30 TO 34 YEARS
99.3/ 100
METRIC RATING
33rd/ 347
METRIC RANK
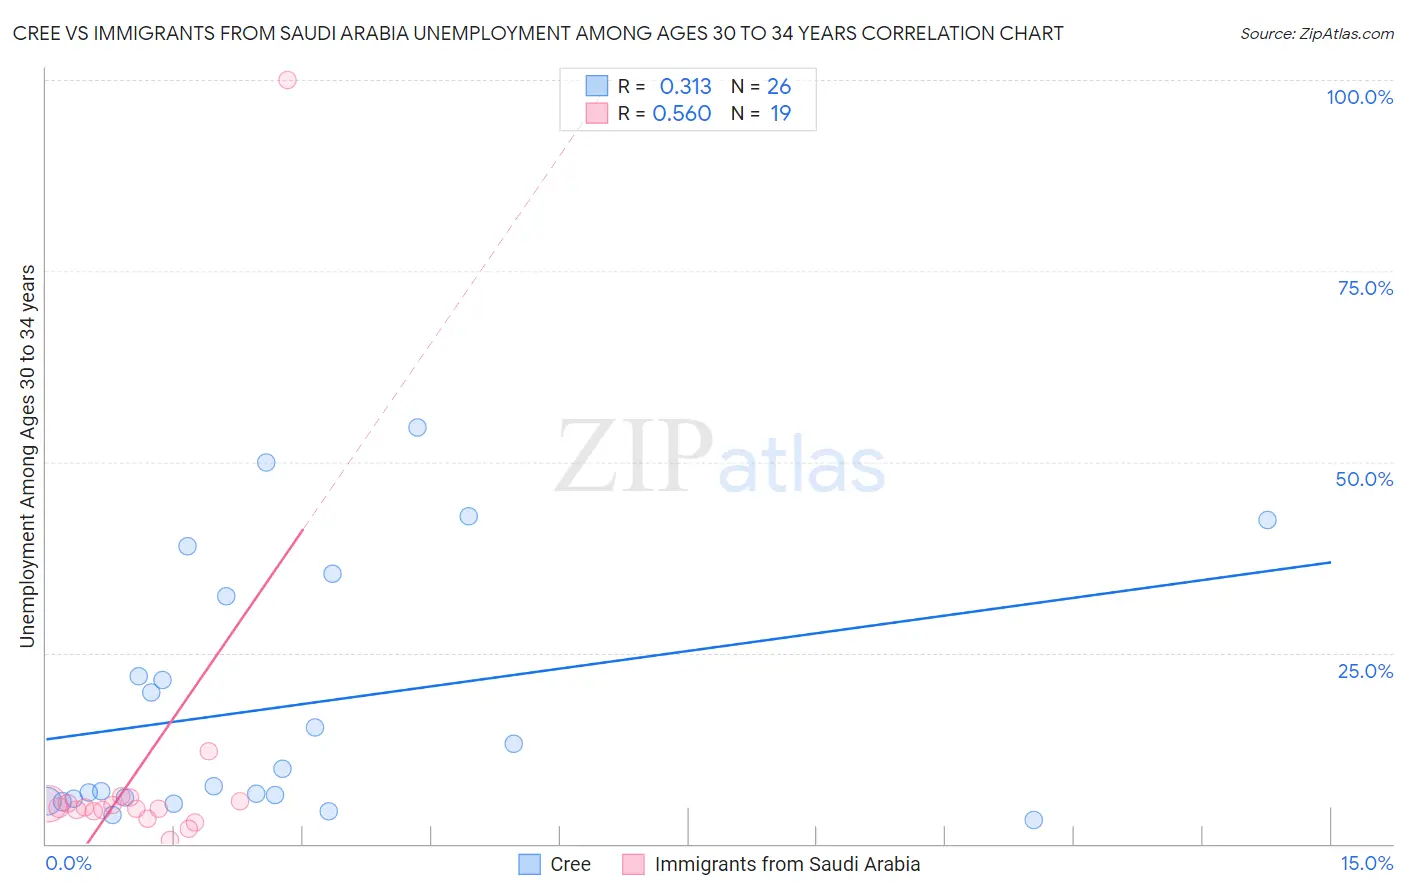
Cree vs Immigrants from Saudi Arabia Unemployment Among Ages 30 to 34 years Correlation Chart
The statistical analysis conducted on geographies consisting of 74,890,168 people shows a mild positive correlation between the proportion of Cree and unemployment rate among population between the ages 30 and 34 in the United States with a correlation coefficient (R) of 0.313 and weighted average of 6.4%. Similarly, the statistical analysis conducted on geographies consisting of 161,358,115 people shows a substantial positive correlation between the proportion of Immigrants from Saudi Arabia and unemployment rate among population between the ages 30 and 34 in the United States with a correlation coefficient (R) of 0.560 and weighted average of 5.0%, a difference of 27.5%.
Unemployment Among Ages 30 to 34 years Correlation Summary
| Measurement | Cree | Immigrants from Saudi Arabia |
| Minimum | 3.1% | 0.48% |
| Maximum | 54.5% | 100.0% |
| Range | 51.4% | 99.5% |
| Mean | 18.1% | 9.8% |
| Median | 8.7% | 4.8% |
| Interquartile 25% (IQ1) | 5.9% | 4.3% |
| Interquartile 75% (IQ3) | 32.4% | 5.5% |
| Interquartile Range (IQR) | 26.5% | 1.2% |
| Standard Deviation (Sample) | 16.3% | 22.0% |
| Standard Deviation (Population) | 16.0% | 21.4% |
Similar Demographics by Unemployment Among Ages 30 to 34 years
Demographics Similar to Cree by Unemployment Among Ages 30 to 34 years
In terms of unemployment among ages 30 to 34 years, the demographic groups most similar to Cree are Cherokee (6.4%, a difference of 0.040%), Immigrants from Caribbean (6.4%, a difference of 0.37%), Osage (6.3%, a difference of 0.48%), Immigrants from Ecuador (6.3%, a difference of 0.56%), and African (6.4%, a difference of 0.74%).
| Demographics | Rating | Rank | Unemployment Among Ages 30 to 34 years |
| Blackfeet | 0.0 /100 | #272 | Tragic 6.3% |
| Ottawa | 0.0 /100 | #273 | Tragic 6.3% |
| U.S. Virgin Islanders | 0.0 /100 | #274 | Tragic 6.3% |
| Ecuadorians | 0.0 /100 | #275 | Tragic 6.3% |
| Pennsylvania Germans | 0.0 /100 | #276 | Tragic 6.3% |
| Immigrants | Ecuador | 0.0 /100 | #277 | Tragic 6.3% |
| Osage | 0.0 /100 | #278 | Tragic 6.3% |
| Cree | 0.0 /100 | #279 | Tragic 6.4% |
| Cherokee | 0.0 /100 | #280 | Tragic 6.4% |
| Immigrants | Caribbean | 0.0 /100 | #281 | Tragic 6.4% |
| Africans | 0.0 /100 | #282 | Tragic 6.4% |
| Hispanics or Latinos | 0.0 /100 | #283 | Tragic 6.4% |
| Immigrants | Bangladesh | 0.0 /100 | #284 | Tragic 6.4% |
| Choctaw | 0.0 /100 | #285 | Tragic 6.4% |
| Central American Indians | 0.0 /100 | #286 | Tragic 6.4% |
Demographics Similar to Immigrants from Saudi Arabia by Unemployment Among Ages 30 to 34 years
In terms of unemployment among ages 30 to 34 years, the demographic groups most similar to Immigrants from Saudi Arabia are Latvian (5.0%, a difference of 0.050%), Immigrants from Zaire (5.0%, a difference of 0.10%), Somali (5.0%, a difference of 0.14%), Norwegian (5.0%, a difference of 0.23%), and German Russian (5.0%, a difference of 0.25%).
| Demographics | Rating | Rank | Unemployment Among Ages 30 to 34 years |
| Immigrants | Kuwait | 99.5 /100 | #26 | Exceptional 5.0% |
| Danes | 99.5 /100 | #27 | Exceptional 5.0% |
| Immigrants | Cuba | 99.4 /100 | #28 | Exceptional 5.0% |
| German Russians | 99.4 /100 | #29 | Exceptional 5.0% |
| Norwegians | 99.4 /100 | #30 | Exceptional 5.0% |
| Somalis | 99.3 /100 | #31 | Exceptional 5.0% |
| Immigrants | Zaire | 99.3 /100 | #32 | Exceptional 5.0% |
| Immigrants | Saudi Arabia | 99.3 /100 | #33 | Exceptional 5.0% |
| Latvians | 99.3 /100 | #34 | Exceptional 5.0% |
| Immigrants | Ethiopia | 99.2 /100 | #35 | Exceptional 5.0% |
| Czechs | 99.2 /100 | #36 | Exceptional 5.0% |
| Immigrants | Turkey | 99.0 /100 | #37 | Exceptional 5.0% |
| Sri Lankans | 99.0 /100 | #38 | Exceptional 5.0% |
| Fijians | 99.0 /100 | #39 | Exceptional 5.0% |
| Immigrants | Vietnam | 98.9 /100 | #40 | Exceptional 5.0% |