Choctaw vs Liberian Female Unemployment
COMPARE
Choctaw
Liberian
Female Unemployment
Female Unemployment Comparison
Choctaw
Liberians
5.4%
FEMALE UNEMPLOYMENT
12.3/ 100
METRIC RATING
210th/ 347
METRIC RANK
5.5%
FEMALE UNEMPLOYMENT
3.9/ 100
METRIC RATING
232nd/ 347
METRIC RANK
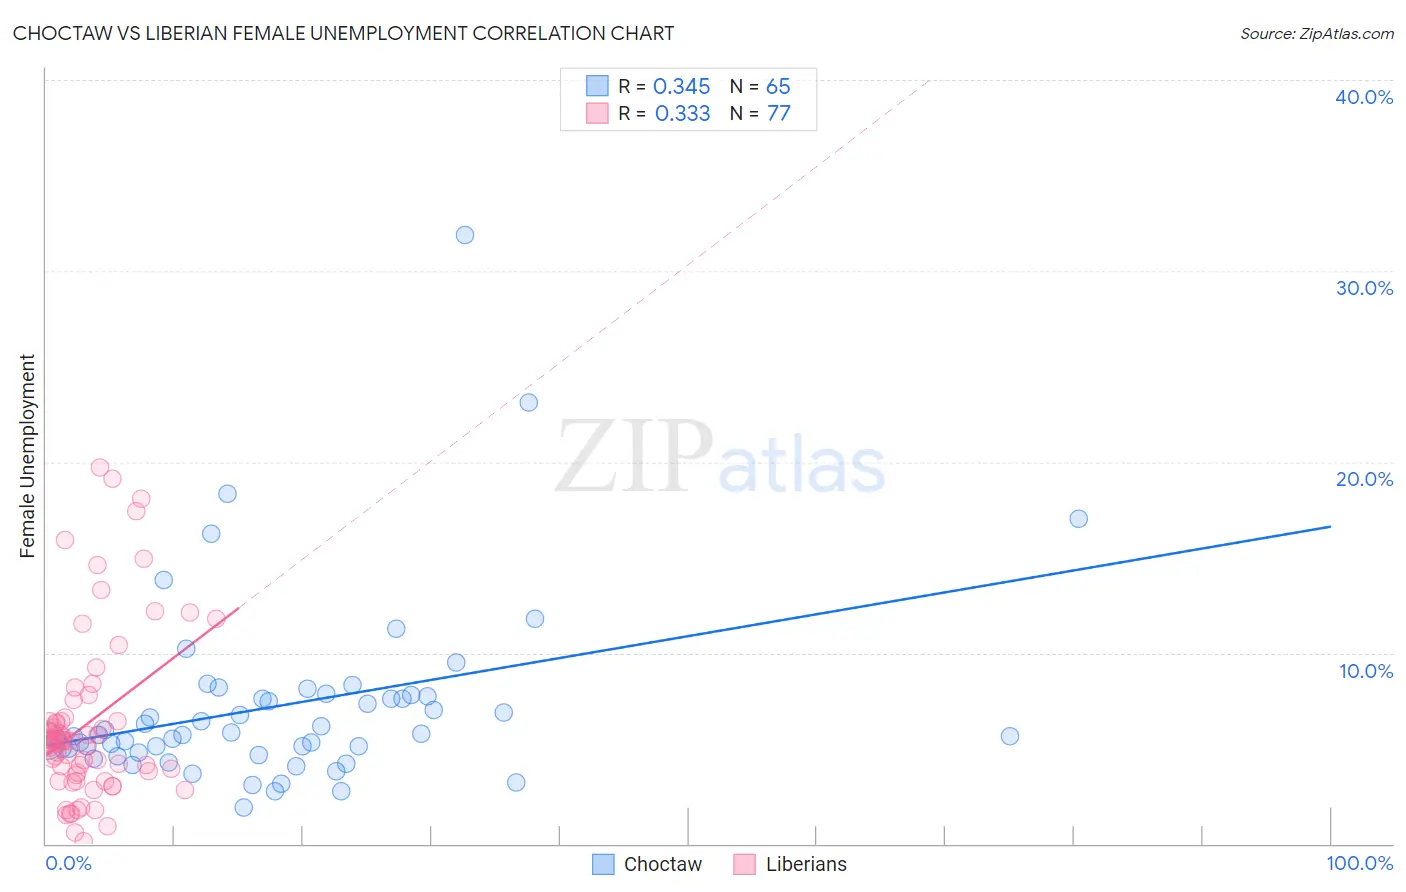
Choctaw vs Liberian Female Unemployment Correlation Chart
The statistical analysis conducted on geographies consisting of 268,280,728 people shows a mild positive correlation between the proportion of Choctaw and unemploymnet rate among females in the United States with a correlation coefficient (R) of 0.345 and weighted average of 5.4%. Similarly, the statistical analysis conducted on geographies consisting of 117,959,005 people shows a mild positive correlation between the proportion of Liberians and unemploymnet rate among females in the United States with a correlation coefficient (R) of 0.333 and weighted average of 5.5%, a difference of 1.8%.
Female Unemployment Correlation Summary
| Measurement | Choctaw | Liberian |
| Minimum | 1.9% | 0.10% |
| Maximum | 31.9% | 19.7% |
| Range | 30.0% | 19.6% |
| Mean | 7.2% | 6.3% |
| Median | 5.7% | 5.4% |
| Interquartile 25% (IQ1) | 4.9% | 3.6% |
| Interquartile 75% (IQ3) | 7.7% | 6.5% |
| Interquartile Range (IQR) | 2.9% | 2.9% |
| Standard Deviation (Sample) | 4.9% | 4.4% |
| Standard Deviation (Population) | 4.9% | 4.4% |
Similar Demographics by Female Unemployment
Demographics Similar to Choctaw by Female Unemployment
In terms of female unemployment, the demographic groups most similar to Choctaw are Ottawa (5.4%, a difference of 0.10%), Uruguayan (5.4%, a difference of 0.12%), Korean (5.4%, a difference of 0.15%), Immigrants from Costa Rica (5.4%, a difference of 0.19%), and Samoan (5.4%, a difference of 0.23%).
| Demographics | Rating | Rank | Female Unemployment |
| Immigrants | South Eastern Asia | 20.3 /100 | #203 | Fair 5.4% |
| Immigrants | Israel | 19.7 /100 | #204 | Poor 5.4% |
| Immigrants | Afghanistan | 18.9 /100 | #205 | Poor 5.4% |
| Immigrants | Brazil | 18.8 /100 | #206 | Poor 5.4% |
| Creek | 15.4 /100 | #207 | Poor 5.4% |
| Immigrants | Costa Rica | 13.7 /100 | #208 | Poor 5.4% |
| Koreans | 13.4 /100 | #209 | Poor 5.4% |
| Choctaw | 12.3 /100 | #210 | Poor 5.4% |
| Ottawa | 11.6 /100 | #211 | Poor 5.4% |
| Uruguayans | 11.4 /100 | #212 | Poor 5.4% |
| Samoans | 10.6 /100 | #213 | Poor 5.4% |
| Seminole | 10.3 /100 | #214 | Poor 5.4% |
| Immigrants | Nicaragua | 10.2 /100 | #215 | Poor 5.4% |
| Comanche | 10.0 /100 | #216 | Poor 5.4% |
| Peruvians | 9.6 /100 | #217 | Tragic 5.4% |
Demographics Similar to Liberians by Female Unemployment
In terms of female unemployment, the demographic groups most similar to Liberians are Immigrants from Iraq (5.5%, a difference of 0.010%), Moroccan (5.5%, a difference of 0.21%), Immigrants from Lebanon (5.5%, a difference of 0.23%), Immigrants from Iran (5.5%, a difference of 0.23%), and Immigrants from Cambodia (5.5%, a difference of 0.27%).
| Demographics | Rating | Rank | Female Unemployment |
| French American Indians | 6.1 /100 | #225 | Tragic 5.5% |
| Immigrants | Peru | 5.9 /100 | #226 | Tragic 5.5% |
| Immigrants | Philippines | 5.3 /100 | #227 | Tragic 5.5% |
| Israelis | 4.8 /100 | #228 | Tragic 5.5% |
| Panamanians | 4.7 /100 | #229 | Tragic 5.5% |
| Immigrants | Uruguay | 4.7 /100 | #230 | Tragic 5.5% |
| Immigrants | Iraq | 3.9 /100 | #231 | Tragic 5.5% |
| Liberians | 3.9 /100 | #232 | Tragic 5.5% |
| Moroccans | 3.4 /100 | #233 | Tragic 5.5% |
| Immigrants | Lebanon | 3.3 /100 | #234 | Tragic 5.5% |
| Immigrants | Iran | 3.3 /100 | #235 | Tragic 5.5% |
| Immigrants | Cambodia | 3.3 /100 | #236 | Tragic 5.5% |
| Immigrants | Panama | 3.2 /100 | #237 | Tragic 5.5% |
| Sierra Leoneans | 3.2 /100 | #238 | Tragic 5.5% |
| Aleuts | 3.0 /100 | #239 | Tragic 5.5% |