Choctaw vs Immigrants from Czechoslovakia Female Unemployment

COMPARE

Choctaw
Race
Ancestry
AfghanAfricanAlaska NativeAlaskan AthabascanAlbanianAleutAlsatianAmericanApacheArabArapahoArgentineanArmenianAssyrian/Chaldean/SyriacAustralianAustrianBahamianBangladeshiBarbadianBasqueBelgianBelizeanBermudanBhutaneseBlackfeetBolivianBrazilianBritishBritish West IndianBulgarianBurmeseCajunCambodianCanadianCape VerdeanCarpatho RusynCelticCentral AmericanCentral American IndianCherokeeCheyenneChickasawChileanChineseChippewaChoctawColombianColvilleComancheCosta RicanCreeCreekCroatianCrowCubanCypriotCzechCzechoslovakianDanishDelawareDominicanDutchDutch West IndianEastern EuropeanEcuadorianEgyptianEnglishEstonianEthiopianEuropeanFijianFilipinoFinnishFrenchFrench American IndianFrench CanadianGermanGerman RussianGhanaianGreekGuamanian/ChamorroGuatemalanGuyaneseHaitianHmongHonduranHopiHoumaHungarianIcelanderIndian (Asian)IndonesianInupiatIranianIraqiIrishIroquoisIsraeliItalianJamaicanJapaneseJordanianKenyanKiowaKoreanLaotianLatvianLebaneseLiberianLithuanianLumbeeLuxembourgerMacedonianMalaysianMalteseMarshalleseMenomineeMexicanMexican American IndianMongolianMoroccanNative HawaiianNavajoNepaleseNew ZealanderNicaraguanNigerianNorthern EuropeanNorwegianOkinawanOsageOttawaPaiutePakistaniPalestinianPanamanianParaguayanPennsylvania GermanPeruvianPimaPolishPortuguesePotawatomiPuebloPuerto RicanPuget Sound SalishRomanianRussianSalvadoranSamoanScandinavianScotch-IrishScottishSeminoleSenegaleseSerbianShoshoneSierra LeoneanSiouxSlavicSlovakSloveneSomaliSouth AfricanSouth AmericanSouth American IndianSoviet UnionSpaniardSpanishSpanish AmericanSpanish American IndianSri LankanSubsaharan AfricanSudaneseSwedishSwissSyrianTaiwaneseThaiTlingit-HaidaTohono O'OdhamTonganTrinidadian and TobagonianTsimshianTurkishU.S. Virgin IslanderUgandanUkrainianUruguayanUteVenezuelanVietnameseWelshWest IndianYakamaYaquiYugoslavianYumanYup'ikZimbabwean
Immigration
NonimmigrantsImmigrantsAfghanistanAfricaAlbaniaArgentinaArmeniaAsiaAustraliaAustriaBahamasBangladeshBarbadosBelarusBelgiumBelizeBoliviaBosnia and HerzegovinaBrazilBulgariaBurma/MyanmarCabo VerdeCambodiaCameroonCanadaCaribbeanCentral AmericaChileChinaColombiaCongoCosta RicaCroatiaCubaDenmarkDominicaDominican RepublicEastern AfricaEastern AsiaEastern EuropeEcuadorEgyptEl SalvadorEnglandEritreaEthiopiaEuropeFijiFranceGermanyGhanaGreeceGrenadaGuatemalaGuyanaHaitiHondurasHong KongHungaryIndiaIndonesiaIranIraqIrelandIsraelItalyJamaicaJapanJordanKazakhstanKenyaKoreaKuwaitLaosLatin AmericaLatviaLebanonLiberiaLithuaniaMalaysiaMexicoMicronesiaMiddle AfricaMoldovaMoroccoNepalNetherlandsNicaraguaNigeriaNorth AmericaNorth MacedoniaNorthern AfricaNorthern EuropeNorwayOceaniaPakistanPanamaPeruPhilippinesPolandPortugalRomaniaRussiaSaudi ArabiaScotlandSenegalSerbiaSierra LeoneSingaporeSomaliaSouth AfricaSouth AmericaSouth Central AsiaSouth Eastern AsiaSouthern EuropeSpainSri LankaSt. Vincent and the GrenadinesSudanSwedenSwitzerlandSyriaTaiwanThailandTrinidad and TobagoTurkeyUgandaUkraineUruguayUzbekistanVenezuelaVietnamWest IndiesWestern AfricaWestern AsiaWestern EuropeYemenZaireZimbabweAzores
Immigrants from Czechoslovakia
Race
Ancestry
AfghanAfricanAlaska NativeAlaskan AthabascanAlbanianAleutAlsatianAmericanApacheArabArapahoArgentineanArmenianAssyrian/Chaldean/SyriacAustralianAustrianBahamianBangladeshiBarbadianBasqueBelgianBelizeanBermudanBhutaneseBlackfeetBolivianBrazilianBritishBritish West IndianBulgarianBurmeseCajunCambodianCanadianCape VerdeanCarpatho RusynCelticCentral AmericanCentral American IndianCherokeeCheyenneChickasawChileanChineseChippewaColombianColvilleComancheCosta RicanCreeCreekCroatianCrowCubanCypriotCzechCzechoslovakianDanishDelawareDominicanDutchDutch West IndianEastern EuropeanEcuadorianEgyptianEnglishEstonianEthiopianEuropeanFijianFilipinoFinnishFrenchFrench American IndianFrench CanadianGermanGerman RussianGhanaianGreekGuamanian/ChamorroGuatemalanGuyaneseHaitianHmongHonduranHopiHoumaHungarianIcelanderIndian (Asian)IndonesianInupiatIranianIraqiIrishIroquoisIsraeliItalianJamaicanJapaneseJordanianKenyanKiowaKoreanLaotianLatvianLebaneseLiberianLithuanianLumbeeLuxembourgerMacedonianMalaysianMalteseMarshalleseMenomineeMexicanMexican American IndianMongolianMoroccanNative HawaiianNavajoNepaleseNew ZealanderNicaraguanNigerianNorthern EuropeanNorwegianOkinawanOsageOttawaPaiutePakistaniPalestinianPanamanianParaguayanPennsylvania GermanPeruvianPimaPolishPortuguesePotawatomiPuebloPuerto RicanPuget Sound SalishRomanianRussianSalvadoranSamoanScandinavianScotch-IrishScottishSeminoleSenegaleseSerbianShoshoneSierra LeoneanSiouxSlavicSlovakSloveneSomaliSouth AfricanSouth AmericanSouth American IndianSoviet UnionSpaniardSpanishSpanish AmericanSpanish American IndianSri LankanSubsaharan AfricanSudaneseSwedishSwissSyrianTaiwaneseThaiTlingit-HaidaTohono O'OdhamTonganTrinidadian and TobagonianTsimshianTurkishU.S. Virgin IslanderUgandanUkrainianUruguayanUteVenezuelanVietnameseWelshWest IndianYakamaYaquiYugoslavianYumanYup'ikZimbabwean
Immigration
NonimmigrantsImmigrantsAfghanistanAfricaAlbaniaArgentinaArmeniaAsiaAustraliaAustriaBahamasBangladeshBarbadosBelarusBelgiumBelizeBoliviaBosnia and HerzegovinaBrazilBulgariaBurma/MyanmarCabo VerdeCambodiaCameroonCanadaCaribbeanCentral AmericaChileChinaColombiaCongoCosta RicaCroatiaCubaCzechoslovakiaDenmarkDominicaDominican RepublicEastern AfricaEastern AsiaEastern EuropeEcuadorEgyptEl SalvadorEnglandEritreaEthiopiaEuropeFijiFranceGermanyGhanaGreeceGrenadaGuatemalaGuyanaHaitiHondurasHong KongHungaryIndiaIndonesiaIranIraqIrelandIsraelItalyJamaicaJapanJordanKazakhstanKenyaKoreaKuwaitLaosLatin AmericaLatviaLebanonLiberiaLithuaniaMalaysiaMexicoMicronesiaMiddle AfricaMoldovaMoroccoNepalNetherlandsNicaraguaNigeriaNorth AmericaNorth MacedoniaNorthern AfricaNorthern EuropeNorwayOceaniaPakistanPanamaPeruPhilippinesPolandPortugalRomaniaRussiaSaudi ArabiaScotlandSenegalSerbiaSierra LeoneSingaporeSomaliaSouth AfricaSouth AmericaSouth Central AsiaSouth Eastern AsiaSouthern EuropeSpainSri LankaSt. Vincent and the GrenadinesSudanSwedenSwitzerlandSyriaTaiwanThailandTrinidad and TobagoTurkeyUgandaUkraineUruguayUzbekistanVenezuelaVietnamWest IndiesWestern AfricaWestern AsiaWestern EuropeYemenZaireZimbabweAzores
Female Unemployment
Income
Poverty
Unemployment
Labor Participation
Family Structure
Vehicle Availability
Education Level
Disability

Female Unemployment Comparison

Choctaw

Immigrants from Czechoslovakia

Poor
Exceptional
5.4%
FEMALE UNEMPLOYMENT
12.3/ 100
METRIC RATING
210th/ 347
METRIC RANK
5.0%
FEMALE UNEMPLOYMENT
95.0/ 100
METRIC RATING
101st/ 347
METRIC RANK

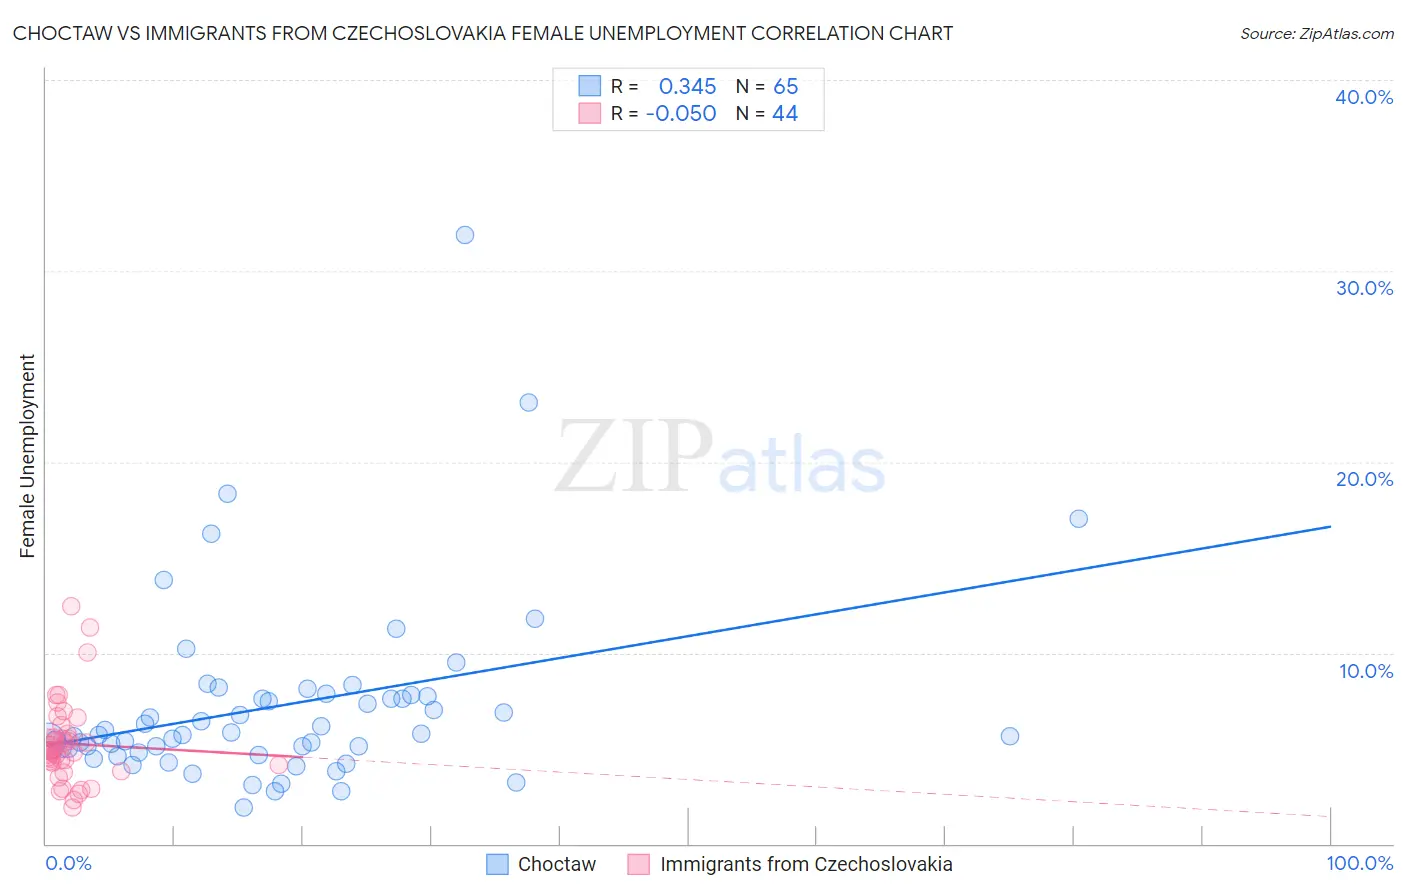
Choctaw vs Immigrants from Czechoslovakia Female Unemployment Correlation Chart

The statistical analysis conducted on geographies consisting of 268,280,728 people shows a mild positive correlation between the proportion of Choctaw and unemploymnet rate among females in the United States with a correlation coefficient (R) of 0.345 and weighted average of 5.4%. Similarly, the statistical analysis conducted on geographies consisting of 195,172,474 people shows no correlation between the proportion of Immigrants from Czechoslovakia and unemploymnet rate among females in the United States with a correlation coefficient (R) of -0.050 and weighted average of 5.0%, a difference of 7.7%.
Choctaw vs Immigrants from Czechoslovakia Female Unemployment

Female Unemployment Correlation Summary

MeasurementChoctawImmigrants from Czechoslovakia
Minimum1.9%1.9%
Maximum31.9%12.4%
Range30.0%10.5%
Mean7.2%5.2%
Median5.7%4.9%
Interquartile 25% (IQ1)4.9%4.2%
Interquartile 75% (IQ3)7.7%5.6%
Interquartile Range (IQR)2.9%1.5%
Standard Deviation (Sample)4.9%2.2%
Standard Deviation (Population)4.9%2.1%

Similar Demographics by Female Unemployment

Demographics Similar to Choctaw by Female Unemployment

In terms of female unemployment, the demographic groups most similar to Choctaw are Ottawa (5.4%, a difference of 0.10%), Uruguayan (5.4%, a difference of 0.12%), Korean (5.4%, a difference of 0.15%), Immigrants from Costa Rica (5.4%, a difference of 0.19%), and Samoan (5.4%, a difference of 0.23%).
DemographicsRating | RankFemale Unemployment
Immigrants | South Eastern Asia
20.3
/100
|
#203
Fair
5.4%
Immigrants | Israel
19.7
/100
|
#204
Poor
5.4%
Immigrants | Afghanistan
18.9
/100
|
#205
Poor
5.4%
Immigrants | Brazil
18.8
/100
|
#206
Poor
5.4%
Creek
15.4
/100
|
#207
Poor
5.4%
Immigrants | Costa Rica
13.7
/100
|
#208
Poor
5.4%
Koreans
13.4
/100
|
#209
Poor
5.4%
Choctaw
12.3
/100
|
#210
Poor
5.4%
Ottawa
11.6
/100
|
#211
Poor
5.4%
Uruguayans
11.4
/100
|
#212
Poor
5.4%
Samoans
10.6
/100
|
#213
Poor
5.4%
Seminole
10.3
/100
|
#214
Poor
5.4%
Immigrants | Nicaragua
10.2
/100
|
#215
Poor
5.4%
Comanche
10.0
/100
|
#216
Poor
5.4%
Peruvians
9.6
/100
|
#217
Tragic
5.4%

Demographics Similar to Immigrants from Czechoslovakia by Female Unemployment

In terms of female unemployment, the demographic groups most similar to Immigrants from Czechoslovakia are Indonesian (5.0%, a difference of 0.040%), Immigrants from Kenya (5.0%, a difference of 0.050%), Immigrants from Zaire (5.0%, a difference of 0.060%), Immigrants from Somalia (5.0%, a difference of 0.070%), and Immigrants from Kuwait (5.0%, a difference of 0.070%).
DemographicsRating | RankFemale Unemployment
Immigrants | Malaysia
95.7
/100
|
#94
Exceptional
5.0%
Burmese
95.6
/100
|
#95
Exceptional
5.0%
Immigrants | South Central Asia
95.5
/100
|
#96
Exceptional
5.0%
Immigrants | Somalia
95.2
/100
|
#97
Exceptional
5.0%
Immigrants | Kuwait
95.2
/100
|
#98
Exceptional
5.0%
Immigrants | Zaire
95.2
/100
|
#99
Exceptional
5.0%
Indonesians
95.1
/100
|
#100
Exceptional
5.0%
Immigrants | Czechoslovakia
95.0
/100
|
#101
Exceptional
5.0%
Immigrants | Kenya
94.8
/100
|
#102
Exceptional
5.0%
Somalis
94.6
/100
|
#103
Exceptional
5.0%
Kenyans
93.7
/100
|
#104
Exceptional
5.0%
Immigrants | England
93.6
/100
|
#105
Exceptional
5.0%
Paraguayans
93.2
/100
|
#106
Exceptional
5.1%
Immigrants | Switzerland
93.1
/100
|
#107
Exceptional
5.1%
Puget Sound Salish
93.0
/100
|
#108
Exceptional
5.1%