Cherokee vs Immigrants from Liberia Unemployment Among Women with Children Under 18 years
COMPARE
Cherokee
Immigrants from Liberia
Unemployment Among Women with Children Under 18 years
Unemployment Among Women with Children Under 18 years Comparison
Cherokee
Immigrants from Liberia
5.7%
UNEMPLOYMENT AMONG WOMEN WITH CHILDREN UNDER 18 YEARS
4.3/ 100
METRIC RATING
226th/ 347
METRIC RANK
6.1%
UNEMPLOYMENT AMONG WOMEN WITH CHILDREN UNDER 18 YEARS
0.1/ 100
METRIC RATING
261st/ 347
METRIC RANK
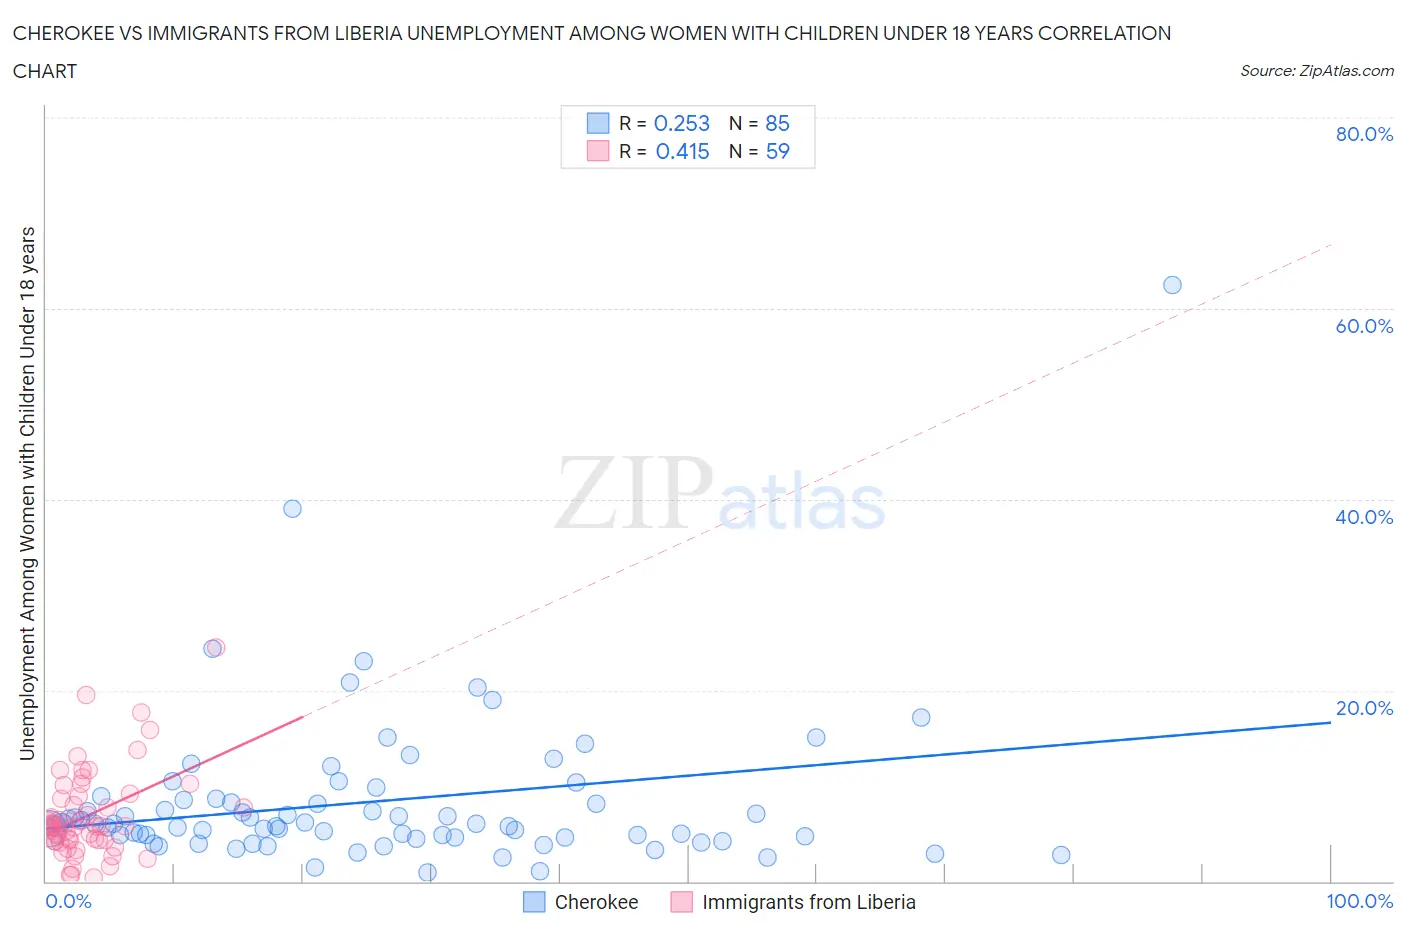
Cherokee vs Immigrants from Liberia Unemployment Among Women with Children Under 18 years Correlation Chart
The statistical analysis conducted on geographies consisting of 460,921,532 people shows a weak positive correlation between the proportion of Cherokee and unemployment rate among women with children under the age of 18 in the United States with a correlation coefficient (R) of 0.253 and weighted average of 5.7%. Similarly, the statistical analysis conducted on geographies consisting of 133,879,342 people shows a moderate positive correlation between the proportion of Immigrants from Liberia and unemployment rate among women with children under the age of 18 in the United States with a correlation coefficient (R) of 0.415 and weighted average of 6.1%, a difference of 6.8%.
Unemployment Among Women with Children Under 18 years Correlation Summary
| Measurement | Cherokee | Immigrants from Liberia |
| Minimum | 0.95% | 0.40% |
| Maximum | 62.5% | 24.5% |
| Range | 61.6% | 24.1% |
| Mean | 8.4% | 6.9% |
| Median | 6.0% | 5.7% |
| Interquartile 25% (IQ1) | 4.6% | 4.2% |
| Interquartile 75% (IQ3) | 8.6% | 8.9% |
| Interquartile Range (IQR) | 4.0% | 4.6% |
| Standard Deviation (Sample) | 8.4% | 4.7% |
| Standard Deviation (Population) | 8.3% | 4.6% |
Similar Demographics by Unemployment Among Women with Children Under 18 years
Demographics Similar to Cherokee by Unemployment Among Women with Children Under 18 years
In terms of unemployment among women with children under 18 years, the demographic groups most similar to Cherokee are Armenian (5.7%, a difference of 0.070%), Immigrants from Syria (5.7%, a difference of 0.12%), Sierra Leonean (5.8%, a difference of 0.20%), Potawatomi (5.7%, a difference of 0.26%), and Osage (5.7%, a difference of 0.28%).
| Demographics | Rating | Rank | Unemployment Among Women with Children Under 18 years |
| Iroquois | 6.5 /100 | #219 | Tragic 5.7% |
| Immigrants | Fiji | 6.3 /100 | #220 | Tragic 5.7% |
| Pennsylvania Germans | 5.7 /100 | #221 | Tragic 5.7% |
| Osage | 5.0 /100 | #222 | Tragic 5.7% |
| Potawatomi | 5.0 /100 | #223 | Tragic 5.7% |
| Immigrants | Syria | 4.6 /100 | #224 | Tragic 5.7% |
| Armenians | 4.5 /100 | #225 | Tragic 5.7% |
| Cherokee | 4.3 /100 | #226 | Tragic 5.7% |
| Sierra Leoneans | 3.8 /100 | #227 | Tragic 5.8% |
| Somalis | 3.5 /100 | #228 | Tragic 5.8% |
| Immigrants | Panama | 3.4 /100 | #229 | Tragic 5.8% |
| Immigrants | South America | 3.2 /100 | #230 | Tragic 5.8% |
| Immigrants | Africa | 3.1 /100 | #231 | Tragic 5.8% |
| Creek | 3.1 /100 | #232 | Tragic 5.8% |
| Spanish Americans | 3.1 /100 | #233 | Tragic 5.8% |
Demographics Similar to Immigrants from Liberia by Unemployment Among Women with Children Under 18 years
In terms of unemployment among women with children under 18 years, the demographic groups most similar to Immigrants from Liberia are Immigrants from Trinidad and Tobago (6.1%, a difference of 0.0%), Spanish American Indian (6.1%, a difference of 0.020%), Comanche (6.1%, a difference of 0.090%), Nigerian (6.1%, a difference of 0.10%), and Ottawa (6.1%, a difference of 0.12%).
| Demographics | Rating | Rank | Unemployment Among Women with Children Under 18 years |
| Immigrants | Azores | 0.3 /100 | #254 | Tragic 6.0% |
| Liberians | 0.2 /100 | #255 | Tragic 6.0% |
| Nepalese | 0.2 /100 | #256 | Tragic 6.0% |
| Bermudans | 0.1 /100 | #257 | Tragic 6.1% |
| Immigrants | Nigeria | 0.1 /100 | #258 | Tragic 6.1% |
| Ottawa | 0.1 /100 | #259 | Tragic 6.1% |
| Nigerians | 0.1 /100 | #260 | Tragic 6.1% |
| Immigrants | Liberia | 0.1 /100 | #261 | Tragic 6.1% |
| Immigrants | Trinidad and Tobago | 0.1 /100 | #262 | Tragic 6.1% |
| Spanish American Indians | 0.1 /100 | #263 | Tragic 6.1% |
| Comanche | 0.1 /100 | #264 | Tragic 6.1% |
| Immigrants | Bahamas | 0.1 /100 | #265 | Tragic 6.1% |
| Sub-Saharan Africans | 0.1 /100 | #266 | Tragic 6.2% |
| French American Indians | 0.1 /100 | #267 | Tragic 6.2% |
| Trinidadians and Tobagonians | 0.1 /100 | #268 | Tragic 6.2% |