Central American vs Osage Unemployment Among Ages 65 to 74 years

COMPARE

Central American
Race
Ancestry
AfghanAfricanAlaska NativeAlaskan AthabascanAlbanianAleutAlsatianAmericanApacheArabArapahoArgentineanArmenianAssyrian/Chaldean/SyriacAustralianAustrianBahamianBangladeshiBarbadianBasqueBelgianBelizeanBermudanBhutaneseBlackfeetBolivianBrazilianBritishBritish West IndianBulgarianBurmeseCajunCambodianCanadianCape VerdeanCarpatho RusynCelticCentral AmericanCentral American IndianCherokeeCheyenneChickasawChileanChineseChippewaChoctawColombianColvilleComancheCosta RicanCreeCreekCroatianCrowCubanCypriotCzechCzechoslovakianDanishDelawareDominicanDutchDutch West IndianEastern EuropeanEcuadorianEgyptianEnglishEstonianEthiopianEuropeanFijianFilipinoFinnishFrenchFrench American IndianFrench CanadianGermanGerman RussianGhanaianGreekGuamanian/ChamorroGuatemalanGuyaneseHaitianHmongHonduranHopiHoumaHungarianIcelanderIndian (Asian)IndonesianInupiatIranianIraqiIrishIroquoisIsraeliItalianJamaicanJapaneseJordanianKenyanKiowaKoreanLaotianLatvianLebaneseLiberianLithuanianLumbeeLuxembourgerMacedonianMalaysianMalteseMarshalleseMenomineeMexicanMexican American IndianMongolianMoroccanNative HawaiianNavajoNepaleseNew ZealanderNicaraguanNigerianNorthern EuropeanNorwegianOkinawanOttawaPaiutePakistaniPalestinianPanamanianParaguayanPennsylvania GermanPeruvianPimaPolishPortuguesePotawatomiPuebloPuerto RicanPuget Sound SalishRomanianRussianSalvadoranSamoanScandinavianScotch-IrishScottishSeminoleSenegaleseSerbianShoshoneSierra LeoneanSiouxSlavicSlovakSloveneSomaliSouth AfricanSouth AmericanSouth American IndianSoviet UnionSpaniardSpanishSpanish AmericanSpanish American IndianSri LankanSubsaharan AfricanSudaneseSwedishSwissSyrianTaiwaneseThaiTlingit-HaidaTohono O'OdhamTonganTrinidadian and TobagonianTsimshianTurkishU.S. Virgin IslanderUgandanUkrainianUruguayanUteVenezuelanVietnameseWelshWest IndianYakamaYaquiYugoslavianYumanYup'ikZimbabwean
Immigration
NonimmigrantsImmigrantsAfghanistanAfricaAlbaniaArgentinaArmeniaAsiaAustraliaAustriaBahamasBangladeshBarbadosBelarusBelgiumBelizeBoliviaBosnia and HerzegovinaBrazilBulgariaBurma/MyanmarCabo VerdeCambodiaCameroonCanadaCaribbeanCentral AmericaChileChinaColombiaCongoCosta RicaCroatiaCubaCzechoslovakiaDenmarkDominicaDominican RepublicEastern AfricaEastern AsiaEastern EuropeEcuadorEgyptEl SalvadorEnglandEritreaEthiopiaEuropeFijiFranceGermanyGhanaGreeceGrenadaGuatemalaGuyanaHaitiHondurasHong KongHungaryIndiaIndonesiaIranIraqIrelandIsraelItalyJamaicaJapanJordanKazakhstanKenyaKoreaKuwaitLaosLatin AmericaLatviaLebanonLiberiaLithuaniaMalaysiaMexicoMicronesiaMiddle AfricaMoldovaMoroccoNepalNetherlandsNicaraguaNigeriaNorth AmericaNorth MacedoniaNorthern AfricaNorthern EuropeNorwayOceaniaPakistanPanamaPeruPhilippinesPolandPortugalRomaniaRussiaSaudi ArabiaScotlandSenegalSerbiaSierra LeoneSingaporeSomaliaSouth AfricaSouth AmericaSouth Central AsiaSouth Eastern AsiaSouthern EuropeSpainSri LankaSt. Vincent and the GrenadinesSudanSwedenSwitzerlandSyriaTaiwanThailandTrinidad and TobagoTurkeyUgandaUkraineUruguayUzbekistanVenezuelaVietnamWest IndiesWestern AfricaWestern AsiaWestern EuropeYemenZaireZimbabweAzores
Osage
Race
Ancestry
AfghanAfricanAlaska NativeAlaskan AthabascanAlbanianAleutAlsatianAmericanApacheArabArapahoArgentineanArmenianAssyrian/Chaldean/SyriacAustralianAustrianBahamianBangladeshiBarbadianBasqueBelgianBelizeanBermudanBhutaneseBlackfeetBolivianBrazilianBritishBritish West IndianBulgarianBurmeseCajunCambodianCanadianCape VerdeanCarpatho RusynCelticCentral American IndianCherokeeCheyenneChickasawChileanChineseChippewaChoctawColombianColvilleComancheCosta RicanCreeCreekCroatianCrowCubanCypriotCzechCzechoslovakianDanishDelawareDominicanDutchDutch West IndianEastern EuropeanEcuadorianEgyptianEnglishEstonianEthiopianEuropeanFijianFilipinoFinnishFrenchFrench American IndianFrench CanadianGermanGerman RussianGhanaianGreekGuamanian/ChamorroGuatemalanGuyaneseHaitianHmongHonduranHopiHoumaHungarianIcelanderIndian (Asian)IndonesianInupiatIranianIraqiIrishIroquoisIsraeliItalianJamaicanJapaneseJordanianKenyanKiowaKoreanLaotianLatvianLebaneseLiberianLithuanianLumbeeLuxembourgerMacedonianMalaysianMalteseMarshalleseMenomineeMexicanMexican American IndianMongolianMoroccanNative HawaiianNavajoNepaleseNew ZealanderNicaraguanNigerianNorthern EuropeanNorwegianOkinawanOsageOttawaPaiutePakistaniPalestinianPanamanianParaguayanPennsylvania GermanPeruvianPimaPolishPortuguesePotawatomiPuebloPuerto RicanPuget Sound SalishRomanianRussianSalvadoranSamoanScandinavianScotch-IrishScottishSeminoleSenegaleseSerbianShoshoneSierra LeoneanSiouxSlavicSlovakSloveneSomaliSouth AfricanSouth AmericanSouth American IndianSoviet UnionSpaniardSpanishSpanish AmericanSpanish American IndianSri LankanSubsaharan AfricanSudaneseSwedishSwissSyrianTaiwaneseThaiTlingit-HaidaTohono O'OdhamTonganTrinidadian and TobagonianTsimshianTurkishU.S. Virgin IslanderUgandanUkrainianUruguayanUteVenezuelanVietnameseWelshWest IndianYakamaYaquiYugoslavianYumanYup'ikZimbabwean
Immigration
NonimmigrantsImmigrantsAfghanistanAfricaAlbaniaArgentinaArmeniaAsiaAustraliaAustriaBahamasBangladeshBarbadosBelarusBelgiumBelizeBoliviaBosnia and HerzegovinaBrazilBulgariaBurma/MyanmarCabo VerdeCambodiaCameroonCanadaCaribbeanCentral AmericaChileChinaColombiaCongoCosta RicaCroatiaCubaCzechoslovakiaDenmarkDominicaDominican RepublicEastern AfricaEastern AsiaEastern EuropeEcuadorEgyptEl SalvadorEnglandEritreaEthiopiaEuropeFijiFranceGermanyGhanaGreeceGrenadaGuatemalaGuyanaHaitiHondurasHong KongHungaryIndiaIndonesiaIranIraqIrelandIsraelItalyJamaicaJapanJordanKazakhstanKenyaKoreaKuwaitLaosLatin AmericaLatviaLebanonLiberiaLithuaniaMalaysiaMexicoMicronesiaMiddle AfricaMoldovaMoroccoNepalNetherlandsNicaraguaNigeriaNorth AmericaNorth MacedoniaNorthern AfricaNorthern EuropeNorwayOceaniaPakistanPanamaPeruPhilippinesPolandPortugalRomaniaRussiaSaudi ArabiaScotlandSenegalSerbiaSierra LeoneSingaporeSomaliaSouth AfricaSouth AmericaSouth Central AsiaSouth Eastern AsiaSouthern EuropeSpainSri LankaSt. Vincent and the GrenadinesSudanSwedenSwitzerlandSyriaTaiwanThailandTrinidad and TobagoTurkeyUgandaUkraineUruguayUzbekistanVenezuelaVietnamWest IndiesWestern AfricaWestern AsiaWestern EuropeYemenZaireZimbabweAzores
Unemployment Among Ages 65 to 74 years
Income
Poverty
Unemployment
Labor Participation
Family Structure
Vehicle Availability
Education Level
Disability

Unemployment Among Ages 65 to 74 years Comparison

Central Americans

Osage

Tragic
Exceptional
5.7%
UNEMPLOYMENT AMONG AGES 65 TO 74 YEARS
0.0/ 100
METRIC RATING
288th/ 347
METRIC RANK
4.7%
UNEMPLOYMENT AMONG AGES 65 TO 74 YEARS
100.0/ 100
METRIC RATING
10th/ 347
METRIC RANK

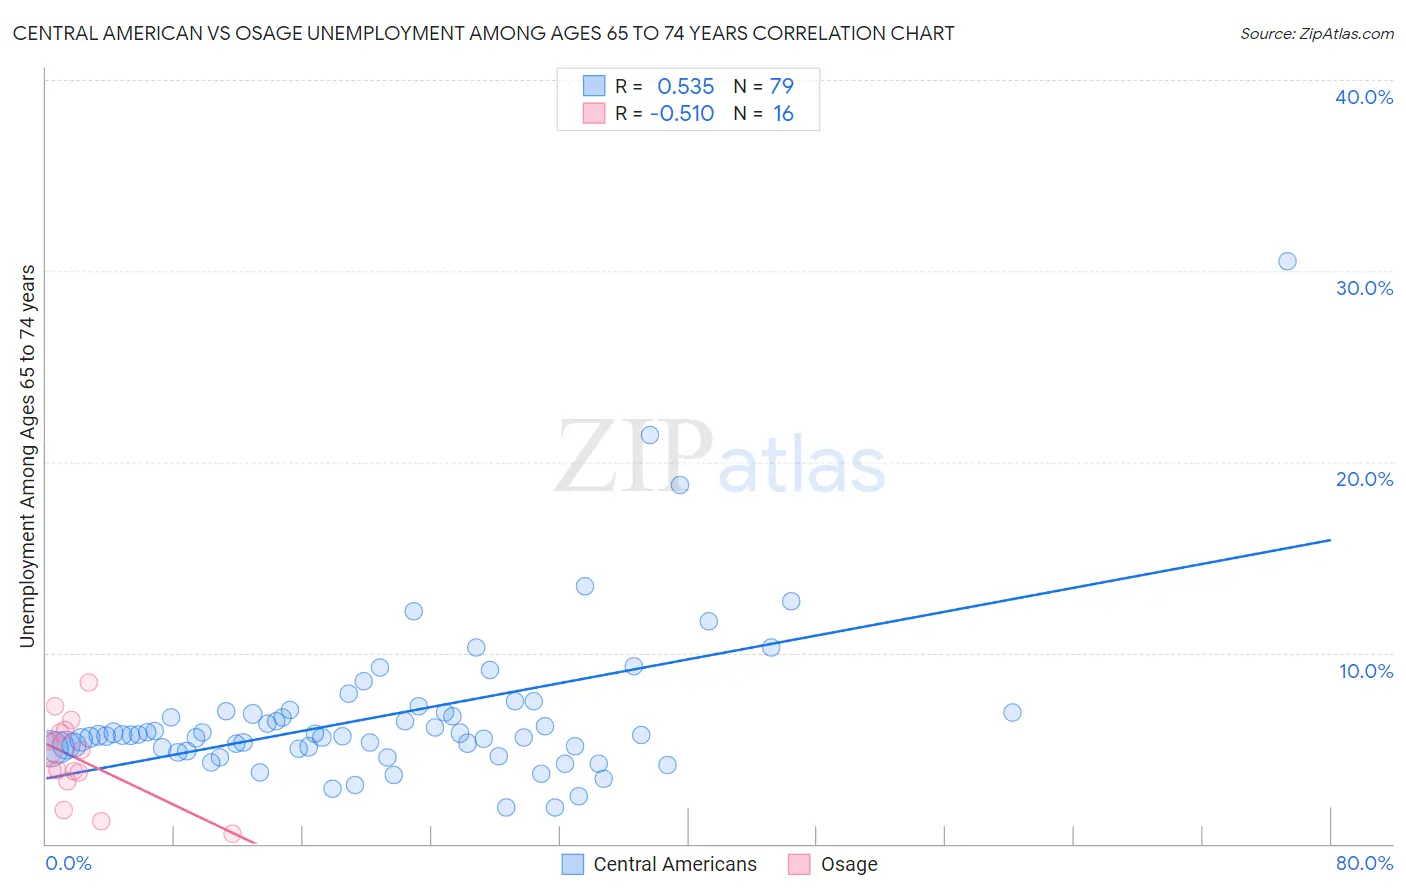
Central American vs Osage Unemployment Among Ages 65 to 74 years Correlation Chart

The statistical analysis conducted on geographies consisting of 420,132,687 people shows a substantial positive correlation between the proportion of Central Americans and unemployment rate among population between the ages 65 and 74 in the United States with a correlation coefficient (R) of 0.535 and weighted average of 5.7%. Similarly, the statistical analysis conducted on geographies consisting of 86,928,141 people shows a substantial negative correlation between the proportion of Osage and unemployment rate among population between the ages 65 and 74 in the United States with a correlation coefficient (R) of -0.510 and weighted average of 4.7%, a difference of 21.5%.
Central American vs Osage Unemployment Among Ages 65 to 74 years

Unemployment Among Ages 65 to 74 years Correlation Summary

MeasurementCentral AmericanOsage
Minimum1.9%0.50%
Maximum30.5%8.4%
Range28.6%7.9%
Mean6.7%4.4%
Median5.7%4.4%
Interquartile 25% (IQ1)5.0%3.5%
Interquartile 75% (IQ3)6.9%5.9%
Interquartile Range (IQR)1.9%2.4%
Standard Deviation (Sample)4.2%2.2%
Standard Deviation (Population)4.1%2.1%

Similar Demographics by Unemployment Among Ages 65 to 74 years

Demographics Similar to Central Americans by Unemployment Among Ages 65 to 74 years

In terms of unemployment among ages 65 to 74 years, the demographic groups most similar to Central Americans are Immigrants from Somalia (5.7%, a difference of 0.0%), Spanish American Indian (5.7%, a difference of 0.26%), Portuguese (5.7%, a difference of 0.30%), Central American Indian (5.7%, a difference of 0.44%), and Marshallese (5.7%, a difference of 0.52%).
DemographicsRating | RankUnemployment Among Ages 65 to 74 years
Immigrants | West Indies
0.1
/100
|
#281
Tragic
5.7%
Ottawa
0.1
/100
|
#282
Tragic
5.7%
Cypriots
0.1
/100
|
#283
Tragic
5.7%
Chippewa
0.1
/100
|
#284
Tragic
5.7%
Immigrants | Sierra Leone
0.1
/100
|
#285
Tragic
5.7%
Marshallese
0.1
/100
|
#286
Tragic
5.7%
Central American Indians
0.0
/100
|
#287
Tragic
5.7%
Central Americans
0.0
/100
|
#288
Tragic
5.7%
Immigrants | Somalia
0.0
/100
|
#289
Tragic
5.7%
Spanish American Indians
0.0
/100
|
#290
Tragic
5.7%
Portuguese
0.0
/100
|
#291
Tragic
5.7%
U.S. Virgin Islanders
0.0
/100
|
#292
Tragic
5.8%
Immigrants | Grenada
0.0
/100
|
#293
Tragic
5.8%
Immigrants | Morocco
0.0
/100
|
#294
Tragic
5.8%
Blacks/African Americans
0.0
/100
|
#295
Tragic
5.8%

Demographics Similar to Osage by Unemployment Among Ages 65 to 74 years

In terms of unemployment among ages 65 to 74 years, the demographic groups most similar to Osage are Chickasaw (4.7%, a difference of 0.11%), Comanche (4.7%, a difference of 0.37%), Immigrants from Congo (4.7%, a difference of 0.41%), Indonesian (4.7%, a difference of 0.55%), and Tongan (4.7%, a difference of 0.57%).
DemographicsRating | RankUnemployment Among Ages 65 to 74 years
Fijians
100.0
/100
|
#3
Exceptional
4.5%
Tsimshian
100.0
/100
|
#4
Exceptional
4.6%
Sudanese
100.0
/100
|
#5
Exceptional
4.6%
Immigrants | Cuba
100.0
/100
|
#6
Exceptional
4.6%
Indonesians
100.0
/100
|
#7
Exceptional
4.7%
Comanche
100.0
/100
|
#8
Exceptional
4.7%
Chickasaw
100.0
/100
|
#9
Exceptional
4.7%
Osage
100.0
/100
|
#10
Exceptional
4.7%
Immigrants | Congo
100.0
/100
|
#11
Exceptional
4.7%
Tongans
100.0
/100
|
#12
Exceptional
4.7%
Lumbee
100.0
/100
|
#13
Exceptional
4.8%
Cubans
100.0
/100
|
#14
Exceptional
4.8%
Immigrants | North Macedonia
100.0
/100
|
#15
Exceptional
4.8%
Immigrants | Burma/Myanmar
100.0
/100
|
#16
Exceptional
4.8%
Kenyans
100.0
/100
|
#17
Exceptional
4.8%