Black/African American vs Immigrants from Guyana Unemployment Among Youth under 25 years

COMPARE

Black/African American
Race
Ancestry
AfghanAfricanAlaska NativeAlaskan AthabascanAlbanianAleutAlsatianAmericanApacheArabArapahoArgentineanArmenianAssyrian/Chaldean/SyriacAustralianAustrianBahamianBangladeshiBarbadianBasqueBelgianBelizeanBermudanBhutaneseBlackfeetBolivianBrazilianBritishBritish West IndianBulgarianBurmeseCajunCambodianCanadianCape VerdeanCarpatho RusynCelticCentral AmericanCentral American IndianCherokeeCheyenneChickasawChileanChineseChippewaChoctawColombianColvilleComancheCosta RicanCreeCreekCroatianCrowCubanCypriotCzechCzechoslovakianDanishDelawareDominicanDutchDutch West IndianEastern EuropeanEcuadorianEgyptianEnglishEstonianEthiopianEuropeanFijianFilipinoFinnishFrenchFrench American IndianFrench CanadianGermanGerman RussianGhanaianGreekGuamanian/ChamorroGuatemalanGuyaneseHaitianHmongHonduranHopiHoumaHungarianIcelanderIndian (Asian)IndonesianInupiatIranianIraqiIrishIroquoisIsraeliItalianJamaicanJapaneseJordanianKenyanKiowaKoreanLaotianLatvianLebaneseLiberianLithuanianLumbeeLuxembourgerMacedonianMalaysianMalteseMarshalleseMenomineeMexicanMexican American IndianMongolianMoroccanNative HawaiianNavajoNepaleseNew ZealanderNicaraguanNigerianNorthern EuropeanNorwegianOkinawanOsageOttawaPaiutePakistaniPalestinianPanamanianParaguayanPennsylvania GermanPeruvianPimaPolishPortuguesePotawatomiPuebloPuerto RicanPuget Sound SalishRomanianRussianSalvadoranSamoanScandinavianScotch-IrishScottishSeminoleSenegaleseSerbianShoshoneSierra LeoneanSiouxSlavicSlovakSloveneSomaliSouth AfricanSouth AmericanSouth American IndianSoviet UnionSpaniardSpanishSpanish AmericanSpanish American IndianSri LankanSubsaharan AfricanSudaneseSwedishSwissSyrianTaiwaneseThaiTlingit-HaidaTohono O'OdhamTonganTrinidadian and TobagonianTsimshianTurkishU.S. Virgin IslanderUgandanUkrainianUruguayanUteVenezuelanVietnameseWelshWest IndianYakamaYaquiYugoslavianYumanYup'ikZimbabwean
Immigration
NonimmigrantsImmigrantsAfghanistanAfricaAlbaniaArgentinaArmeniaAsiaAustraliaAustriaBahamasBangladeshBarbadosBelarusBelgiumBelizeBoliviaBosnia and HerzegovinaBrazilBulgariaBurma/MyanmarCabo VerdeCambodiaCameroonCanadaCaribbeanCentral AmericaChileChinaColombiaCongoCosta RicaCroatiaCubaCzechoslovakiaDenmarkDominicaDominican RepublicEastern AfricaEastern AsiaEastern EuropeEcuadorEgyptEl SalvadorEnglandEritreaEthiopiaEuropeFijiFranceGermanyGhanaGreeceGrenadaGuatemalaHaitiHondurasHong KongHungaryIndiaIndonesiaIranIraqIrelandIsraelItalyJamaicaJapanJordanKazakhstanKenyaKoreaKuwaitLaosLatin AmericaLatviaLebanonLiberiaLithuaniaMalaysiaMexicoMicronesiaMiddle AfricaMoldovaMoroccoNepalNetherlandsNicaraguaNigeriaNorth AmericaNorth MacedoniaNorthern AfricaNorthern EuropeNorwayOceaniaPakistanPanamaPeruPhilippinesPolandPortugalRomaniaRussiaSaudi ArabiaScotlandSenegalSerbiaSierra LeoneSingaporeSomaliaSouth AfricaSouth AmericaSouth Central AsiaSouth Eastern AsiaSouthern EuropeSpainSri LankaSt. Vincent and the GrenadinesSudanSwedenSwitzerlandSyriaTaiwanThailandTrinidad and TobagoTurkeyUgandaUkraineUruguayUzbekistanVenezuelaVietnamWest IndiesWestern AfricaWestern AsiaWestern EuropeYemenZaireZimbabweAzores
Immigrants from Guyana
Race
Ancestry
AfghanAfricanAlaska NativeAlaskan AthabascanAlbanianAleutAlsatianAmericanApacheArabArapahoArgentineanArmenianAssyrian/Chaldean/SyriacAustralianAustrianBahamianBangladeshiBarbadianBasqueBelgianBelizeanBermudanBhutaneseBlackfeetBolivianBrazilianBritishBritish West IndianBulgarianBurmeseCajunCambodianCanadianCape VerdeanCarpatho RusynCelticCentral AmericanCentral American IndianCherokeeCheyenneChickasawChileanChineseChippewaChoctawColombianColvilleComancheCosta RicanCreeCreekCroatianCrowCubanCypriotCzechCzechoslovakianDanishDelawareDominicanDutchDutch West IndianEastern EuropeanEcuadorianEgyptianEnglishEstonianEthiopianEuropeanFijianFilipinoFinnishFrenchFrench American IndianFrench CanadianGermanGerman RussianGhanaianGreekGuamanian/ChamorroGuatemalanGuyaneseHaitianHmongHonduranHopiHoumaHungarianIcelanderIndian (Asian)IndonesianInupiatIranianIraqiIrishIroquoisIsraeliItalianJamaicanJapaneseJordanianKenyanKiowaKoreanLaotianLatvianLebaneseLiberianLithuanianLumbeeLuxembourgerMacedonianMalaysianMalteseMarshalleseMenomineeMexicanMexican American IndianMongolianMoroccanNative HawaiianNavajoNepaleseNew ZealanderNicaraguanNigerianNorthern EuropeanNorwegianOkinawanOsageOttawaPaiutePakistaniPalestinianPanamanianParaguayanPennsylvania GermanPeruvianPimaPolishPortuguesePotawatomiPuebloPuerto RicanPuget Sound SalishRomanianRussianSalvadoranSamoanScandinavianScotch-IrishScottishSeminoleSenegaleseSerbianShoshoneSierra LeoneanSiouxSlavicSlovakSloveneSomaliSouth AfricanSouth AmericanSouth American IndianSoviet UnionSpaniardSpanishSpanish AmericanSpanish American IndianSri LankanSubsaharan AfricanSudaneseSwedishSwissSyrianTaiwaneseThaiTlingit-HaidaTohono O'OdhamTonganTrinidadian and TobagonianTsimshianTurkishU.S. Virgin IslanderUgandanUkrainianUruguayanUteVenezuelanVietnameseWelshWest IndianYakamaYaquiYugoslavianYumanYup'ikZimbabwean
Immigration
NonimmigrantsImmigrantsAfghanistanAfricaAlbaniaArgentinaArmeniaAsiaAustraliaAustriaBahamasBangladeshBarbadosBelarusBelgiumBelizeBoliviaBosnia and HerzegovinaBrazilBulgariaBurma/MyanmarCabo VerdeCambodiaCameroonCanadaCaribbeanCentral AmericaChileChinaColombiaCongoCosta RicaCroatiaCubaCzechoslovakiaDenmarkDominicaDominican RepublicEastern AfricaEastern AsiaEastern EuropeEcuadorEgyptEl SalvadorEnglandEritreaEthiopiaEuropeFijiFranceGermanyGhanaGreeceGrenadaGuatemalaGuyanaHaitiHondurasHong KongHungaryIndiaIndonesiaIranIraqIrelandIsraelItalyJamaicaJapanJordanKazakhstanKenyaKoreaKuwaitLaosLatin AmericaLatviaLebanonLiberiaLithuaniaMalaysiaMexicoMicronesiaMiddle AfricaMoldovaMoroccoNepalNetherlandsNicaraguaNigeriaNorth AmericaNorth MacedoniaNorthern AfricaNorthern EuropeNorwayOceaniaPakistanPanamaPeruPhilippinesPolandPortugalRomaniaRussiaSaudi ArabiaScotlandSenegalSerbiaSierra LeoneSingaporeSomaliaSouth AfricaSouth AmericaSouth Central AsiaSouth Eastern AsiaSouthern EuropeSpainSri LankaSt. Vincent and the GrenadinesSudanSwedenSwitzerlandSyriaTaiwanThailandTrinidad and TobagoTurkeyUgandaUkraineUruguayUzbekistanVenezuelaVietnamWest IndiesWestern AfricaWestern AsiaWestern EuropeYemenZaireZimbabweAzores
Unemployment Among Youth under 25 years
Income
Poverty
Unemployment
Labor Participation
Family Structure
Vehicle Availability
Education Level
Disability

Unemployment Among Youth under 25 years Comparison

Blacks/African Americans

Immigrants from Guyana

Tragic
Tragic
14.5%
UNEMPLOYMENT AMONG YOUTH UNDER 25 YEARS
0.0/ 100
METRIC RATING
317th/ 347
METRIC RANK
15.9%
UNEMPLOYMENT AMONG YOUTH UNDER 25 YEARS
0.0/ 100
METRIC RATING
334th/ 347
METRIC RANK

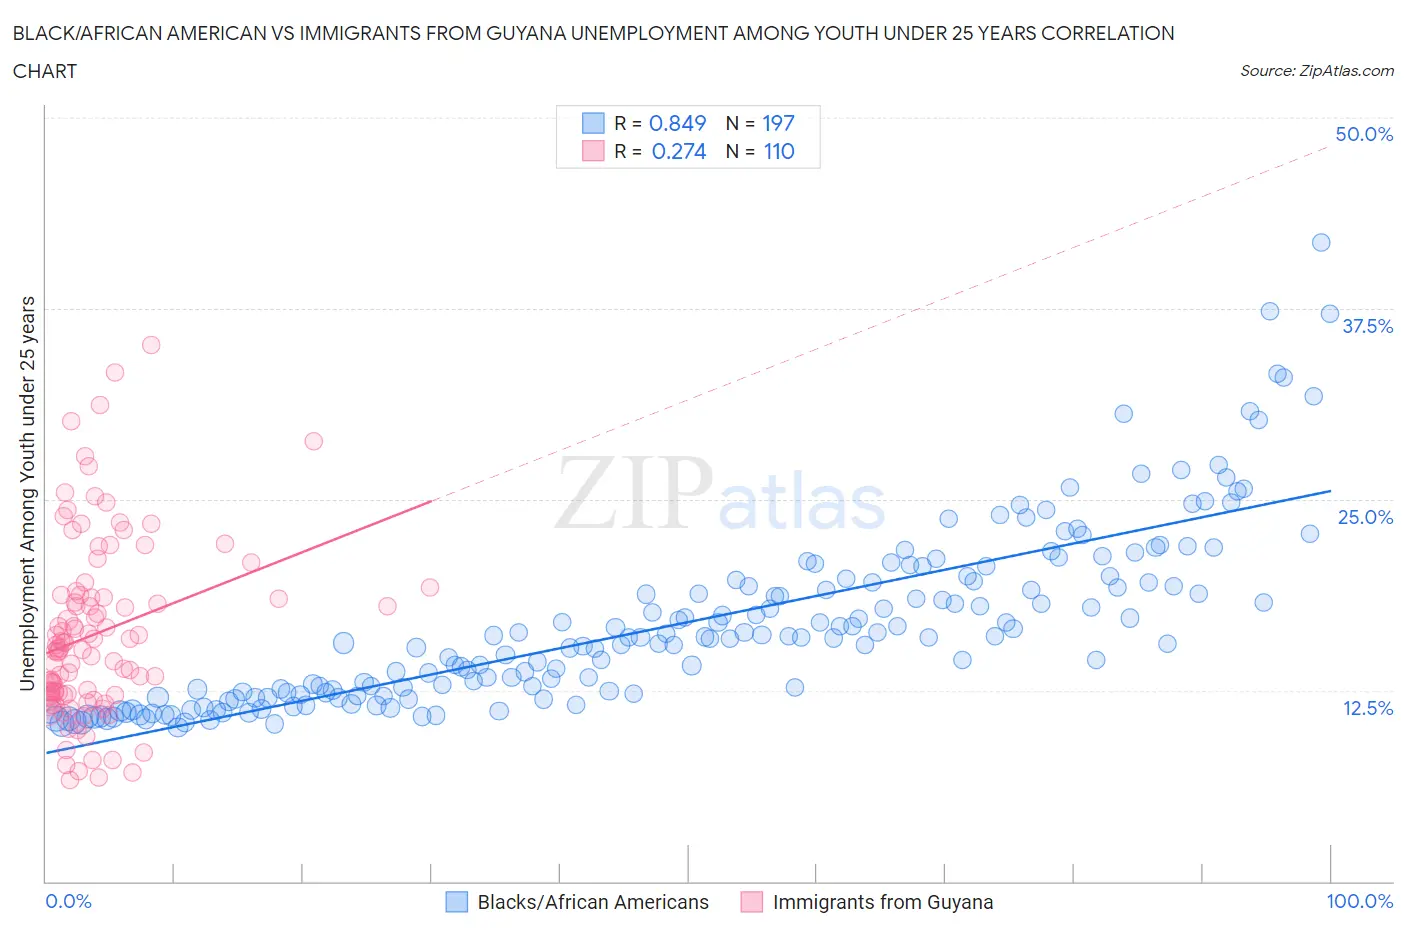
Black/African American vs Immigrants from Guyana Unemployment Among Youth under 25 years Correlation Chart

The statistical analysis conducted on geographies consisting of 545,283,249 people shows a very strong positive correlation between the proportion of Blacks/African Americans and unemployment rate among youth under the age of 25 in the United States with a correlation coefficient (R) of 0.849 and weighted average of 14.5%. Similarly, the statistical analysis conducted on geographies consisting of 182,851,664 people shows a weak positive correlation between the proportion of Immigrants from Guyana and unemployment rate among youth under the age of 25 in the United States with a correlation coefficient (R) of 0.274 and weighted average of 15.9%, a difference of 10.1%.
Black/African American vs Immigrants from Guyana Unemployment Among Youth under 25 years

Unemployment Among Youth under 25 years Correlation Summary

MeasurementBlack/African AmericanImmigrants from Guyana
Minimum10.1%6.6%
Maximum41.8%35.1%
Range31.7%28.5%
Mean16.9%16.2%
Median15.9%15.3%
Interquartile 25% (IQ1)12.2%12.3%
Interquartile 75% (IQ3)19.6%18.7%
Interquartile Range (IQR)7.4%6.4%
Standard Deviation (Sample)5.8%5.8%
Standard Deviation (Population)5.8%5.8%

Demographics Similar to Blacks/African Americans and Immigrants from Guyana by Unemployment Among Youth under 25 years

In terms of unemployment among youth under 25 years, the demographic groups most similar to Blacks/African Americans are Native/Alaskan (14.5%, a difference of 0.090%), Sioux (14.4%, a difference of 0.51%), Immigrants from Dominica (14.6%, a difference of 0.72%), West Indian (14.6%, a difference of 0.76%), and Barbadian (14.6%, a difference of 0.80%). Similarly, the demographic groups most similar to Immigrants from Guyana are Guyanese (15.9%, a difference of 0.25%), Immigrants from Grenada (15.8%, a difference of 0.71%), Immigrants from St. Vincent and the Grenadines (16.1%, a difference of 1.3%), Dominican (15.7%, a difference of 1.4%), and Yakama (15.6%, a difference of 2.2%).
DemographicsRating | RankUnemployment Among Youth under 25 years
Sioux
0.0
/100
|
#315
Tragic
14.4%
Natives/Alaskans
0.0
/100
|
#316
Tragic
14.5%
Blacks/African Americans
0.0
/100
|
#317
Tragic
14.5%
Immigrants | Dominica
0.0
/100
|
#318
Tragic
14.6%
West Indians
0.0
/100
|
#319
Tragic
14.6%
Barbadians
0.0
/100
|
#320
Tragic
14.6%
Cheyenne
0.0
/100
|
#321
Tragic
14.6%
Trinidadians and Tobagonians
0.0
/100
|
#322
Tragic
14.6%
Immigrants | Trinidad and Tobago
0.0
/100
|
#323
Tragic
14.6%
Immigrants | Jamaica
0.0
/100
|
#324
Tragic
14.8%
Alaska Natives
0.0
/100
|
#325
Tragic
14.9%
Immigrants | Barbados
0.0
/100
|
#326
Tragic
15.2%
British West Indians
0.0
/100
|
#327
Tragic
15.5%
Immigrants | Dominican Republic
0.0
/100
|
#328
Tragic
15.6%
Immigrants | Yemen
0.0
/100
|
#329
Tragic
15.6%
Yakama
0.0
/100
|
#330
Tragic
15.6%
Dominicans
0.0
/100
|
#331
Tragic
15.7%
Immigrants | Grenada
0.0
/100
|
#332
Tragic
15.8%
Guyanese
0.0
/100
|
#333
Tragic
15.9%
Immigrants | Guyana
0.0
/100
|
#334
Tragic
15.9%
Immigrants | St. Vincent and the Grenadines
0.0
/100
|
#335
Tragic
16.1%