Belgian vs Polish Unemployment Among Youth under 25 years
COMPARE
Belgian
Polish
Unemployment Among Youth under 25 years
Unemployment Among Youth under 25 years Comparison
Belgians
Poles
10.6%
UNEMPLOYMENT AMONG YOUTH UNDER 25 YEARS
100.0/ 100
METRIC RATING
22nd/ 347
METRIC RANK
11.0%
UNEMPLOYMENT AMONG YOUTH UNDER 25 YEARS
99.3/ 100
METRIC RATING
48th/ 347
METRIC RANK
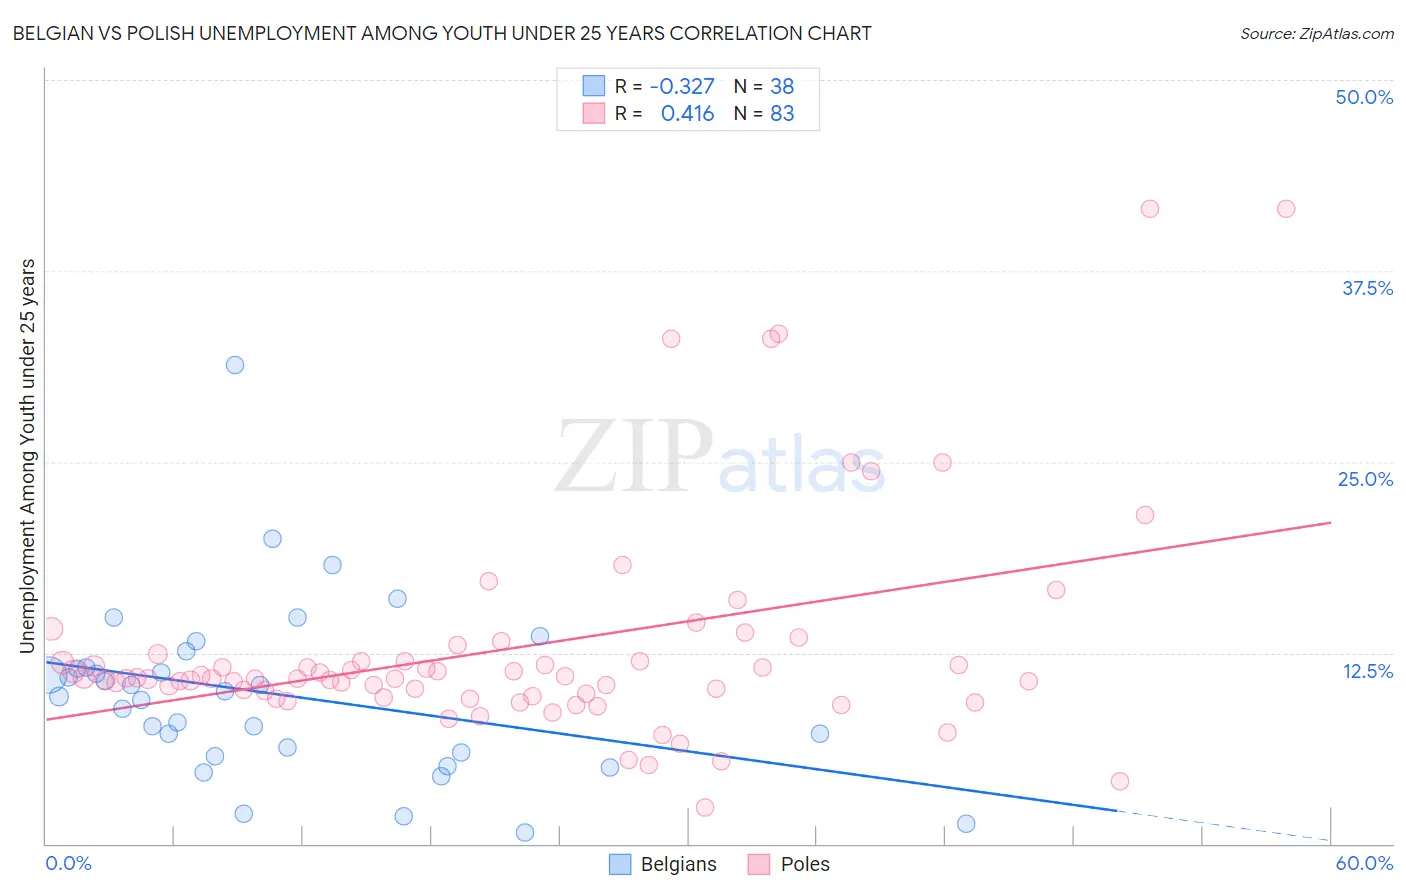
Belgian vs Polish Unemployment Among Youth under 25 years Correlation Chart
The statistical analysis conducted on geographies consisting of 350,624,639 people shows a mild negative correlation between the proportion of Belgians and unemployment rate among youth under the age of 25 in the United States with a correlation coefficient (R) of -0.327 and weighted average of 10.6%. Similarly, the statistical analysis conducted on geographies consisting of 537,929,649 people shows a moderate positive correlation between the proportion of Poles and unemployment rate among youth under the age of 25 in the United States with a correlation coefficient (R) of 0.416 and weighted average of 11.0%, a difference of 3.6%.
Unemployment Among Youth under 25 years Correlation Summary
| Measurement | Belgian | Polish |
| Minimum | 0.70% | 2.4% |
| Maximum | 31.3% | 41.6% |
| Range | 30.6% | 39.2% |
| Mean | 9.8% | 12.8% |
| Median | 9.8% | 10.8% |
| Interquartile 25% (IQ1) | 6.0% | 9.7% |
| Interquartile 75% (IQ3) | 11.5% | 12.0% |
| Interquartile Range (IQR) | 5.5% | 2.3% |
| Standard Deviation (Sample) | 5.8% | 7.2% |
| Standard Deviation (Population) | 5.7% | 7.2% |
Similar Demographics by Unemployment Among Youth under 25 years
Demographics Similar to Belgians by Unemployment Among Youth under 25 years
In terms of unemployment among youth under 25 years, the demographic groups most similar to Belgians are Pennsylvania German (10.6%, a difference of 0.010%), Immigrants from Bosnia and Herzegovina (10.6%, a difference of 0.060%), Dutch (10.6%, a difference of 0.22%), Immigrants from Burma/Myanmar (10.6%, a difference of 0.25%), and Swiss (10.6%, a difference of 0.26%).
| Demographics | Rating | Rank | Unemployment Among Youth under 25 years |
| Sudanese | 100.0 /100 | #15 | Exceptional 10.6% |
| Venezuelans | 100.0 /100 | #16 | Exceptional 10.6% |
| Menominee | 100.0 /100 | #17 | Exceptional 10.6% |
| Swiss | 100.0 /100 | #18 | Exceptional 10.6% |
| Immigrants | Burma/Myanmar | 100.0 /100 | #19 | Exceptional 10.6% |
| Dutch | 100.0 /100 | #20 | Exceptional 10.6% |
| Pennsylvania Germans | 100.0 /100 | #21 | Exceptional 10.6% |
| Belgians | 100.0 /100 | #22 | Exceptional 10.6% |
| Immigrants | Bosnia and Herzegovina | 100.0 /100 | #23 | Exceptional 10.6% |
| Finns | 100.0 /100 | #24 | Exceptional 10.7% |
| Immigrants | North Macedonia | 100.0 /100 | #25 | Exceptional 10.7% |
| Immigrants | India | 100.0 /100 | #26 | Exceptional 10.7% |
| Yugoslavians | 100.0 /100 | #27 | Exceptional 10.7% |
| Somalis | 100.0 /100 | #28 | Exceptional 10.7% |
| Chinese | 99.9 /100 | #29 | Exceptional 10.7% |
Demographics Similar to Poles by Unemployment Among Youth under 25 years
In terms of unemployment among youth under 25 years, the demographic groups most similar to Poles are Thai (11.0%, a difference of 0.070%), Czechoslovakian (11.0%, a difference of 0.17%), Serbian (11.0%, a difference of 0.40%), Latvian (11.0%, a difference of 0.42%), and Ottawa (11.1%, a difference of 0.50%).
| Demographics | Rating | Rank | Unemployment Among Youth under 25 years |
| Croatians | 99.8 /100 | #41 | Exceptional 10.9% |
| Cambodians | 99.7 /100 | #42 | Exceptional 10.9% |
| British | 99.7 /100 | #43 | Exceptional 10.9% |
| Welsh | 99.7 /100 | #44 | Exceptional 10.9% |
| Bulgarians | 99.6 /100 | #45 | Exceptional 10.9% |
| Tongans | 99.6 /100 | #46 | Exceptional 10.9% |
| Australians | 99.6 /100 | #47 | Exceptional 10.9% |
| Poles | 99.3 /100 | #48 | Exceptional 11.0% |
| Thais | 99.3 /100 | #49 | Exceptional 11.0% |
| Czechoslovakians | 99.2 /100 | #50 | Exceptional 11.0% |
| Serbians | 99.0 /100 | #51 | Exceptional 11.0% |
| Latvians | 99.0 /100 | #52 | Exceptional 11.0% |
| Ottawa | 99.0 /100 | #53 | Exceptional 11.1% |
| Mongolians | 98.9 /100 | #54 | Exceptional 11.1% |
| Irish | 98.9 /100 | #55 | Exceptional 11.1% |