Belgian vs Polish Child Poverty Among Boys Under 16

COMPARE

Belgian
Race
Ancestry
AfghanAfricanAlaska NativeAlaskan AthabascanAlbanianAleutAlsatianAmericanApacheArabArapahoArgentineanArmenianAssyrian/Chaldean/SyriacAustralianAustrianBahamianBangladeshiBarbadianBasqueBelgianBelizeanBermudanBhutaneseBlackfeetBolivianBrazilianBritishBritish West IndianBulgarianBurmeseCajunCambodianCanadianCape VerdeanCarpatho RusynCelticCentral AmericanCentral American IndianCherokeeCheyenneChickasawChileanChineseChippewaChoctawColombianColvilleComancheCosta RicanCreeCreekCroatianCrowCubanCypriotCzechCzechoslovakianDanishDelawareDominicanDutchDutch West IndianEastern EuropeanEcuadorianEgyptianEnglishEstonianEthiopianEuropeanFijianFilipinoFinnishFrenchFrench American IndianFrench CanadianGermanGerman RussianGhanaianGreekGuamanian/ChamorroGuatemalanGuyaneseHaitianHmongHonduranHopiHoumaHungarianIcelanderIndian (Asian)IndonesianInupiatIranianIraqiIrishIroquoisIsraeliItalianJamaicanJapaneseJordanianKenyanKiowaKoreanLaotianLatvianLebaneseLiberianLithuanianLumbeeLuxembourgerMacedonianMalaysianMalteseMarshalleseMenomineeMexicanMexican American IndianMongolianMoroccanNative HawaiianNavajoNepaleseNew ZealanderNicaraguanNigerianNorthern EuropeanNorwegianOkinawanOsageOttawaPaiutePakistaniPalestinianPanamanianParaguayanPennsylvania GermanPeruvianPimaPortuguesePotawatomiPuebloPuerto RicanPuget Sound SalishRomanianRussianSalvadoranSamoanScandinavianScotch-IrishScottishSeminoleSenegaleseSerbianShoshoneSierra LeoneanSiouxSlavicSlovakSloveneSomaliSouth AfricanSouth AmericanSouth American IndianSoviet UnionSpaniardSpanishSpanish AmericanSpanish American IndianSri LankanSubsaharan AfricanSudaneseSwedishSwissSyrianTaiwaneseThaiTlingit-HaidaTohono O'OdhamTonganTrinidadian and TobagonianTsimshianTurkishU.S. Virgin IslanderUgandanUkrainianUruguayanUteVenezuelanVietnameseWelshWest IndianYakamaYaquiYugoslavianYumanYup'ikZimbabwean
Immigration
NonimmigrantsImmigrantsAfghanistanAfricaAlbaniaArgentinaArmeniaAsiaAustraliaAustriaBahamasBangladeshBarbadosBelarusBelgiumBelizeBoliviaBosnia and HerzegovinaBrazilBulgariaBurma/MyanmarCabo VerdeCambodiaCameroonCanadaCaribbeanCentral AmericaChileChinaColombiaCongoCosta RicaCroatiaCubaCzechoslovakiaDenmarkDominicaDominican RepublicEastern AfricaEastern AsiaEastern EuropeEcuadorEgyptEl SalvadorEnglandEritreaEthiopiaEuropeFijiFranceGermanyGhanaGreeceGrenadaGuatemalaGuyanaHaitiHondurasHong KongHungaryIndiaIndonesiaIranIraqIrelandIsraelItalyJamaicaJapanJordanKazakhstanKenyaKoreaKuwaitLaosLatin AmericaLatviaLebanonLiberiaLithuaniaMalaysiaMexicoMicronesiaMiddle AfricaMoldovaMoroccoNepalNetherlandsNicaraguaNigeriaNorth AmericaNorth MacedoniaNorthern AfricaNorthern EuropeNorwayOceaniaPakistanPanamaPeruPhilippinesPolandPortugalRomaniaRussiaSaudi ArabiaScotlandSenegalSerbiaSierra LeoneSingaporeSomaliaSouth AfricaSouth AmericaSouth Central AsiaSouth Eastern AsiaSouthern EuropeSpainSri LankaSt. Vincent and the GrenadinesSudanSwedenSwitzerlandSyriaTaiwanThailandTrinidad and TobagoTurkeyUgandaUkraineUruguayUzbekistanVenezuelaVietnamWest IndiesWestern AfricaWestern AsiaWestern EuropeYemenZaireZimbabweAzores
Polish
Race
Ancestry
AfghanAfricanAlaska NativeAlaskan AthabascanAlbanianAleutAlsatianAmericanApacheArabArapahoArgentineanArmenianAssyrian/Chaldean/SyriacAustralianAustrianBahamianBangladeshiBarbadianBasqueBelizeanBermudanBhutaneseBlackfeetBolivianBrazilianBritishBritish West IndianBulgarianBurmeseCajunCambodianCanadianCape VerdeanCarpatho RusynCelticCentral AmericanCentral American IndianCherokeeCheyenneChickasawChileanChineseChippewaChoctawColombianColvilleComancheCosta RicanCreeCreekCroatianCrowCubanCypriotCzechCzechoslovakianDanishDelawareDominicanDutchDutch West IndianEastern EuropeanEcuadorianEgyptianEnglishEstonianEthiopianEuropeanFijianFilipinoFinnishFrenchFrench American IndianFrench CanadianGermanGerman RussianGhanaianGreekGuamanian/ChamorroGuatemalanGuyaneseHaitianHmongHonduranHopiHoumaHungarianIcelanderIndian (Asian)IndonesianInupiatIranianIraqiIrishIroquoisIsraeliItalianJamaicanJapaneseJordanianKenyanKiowaKoreanLaotianLatvianLebaneseLiberianLithuanianLumbeeLuxembourgerMacedonianMalaysianMalteseMarshalleseMenomineeMexicanMexican American IndianMongolianMoroccanNative HawaiianNavajoNepaleseNew ZealanderNicaraguanNigerianNorthern EuropeanNorwegianOkinawanOsageOttawaPaiutePakistaniPalestinianPanamanianParaguayanPennsylvania GermanPeruvianPimaPolishPortuguesePotawatomiPuebloPuerto RicanPuget Sound SalishRomanianRussianSalvadoranSamoanScandinavianScotch-IrishScottishSeminoleSenegaleseSerbianShoshoneSierra LeoneanSiouxSlavicSlovakSloveneSomaliSouth AfricanSouth AmericanSouth American IndianSoviet UnionSpaniardSpanishSpanish AmericanSpanish American IndianSri LankanSubsaharan AfricanSudaneseSwedishSwissSyrianTaiwaneseThaiTlingit-HaidaTohono O'OdhamTonganTrinidadian and TobagonianTsimshianTurkishU.S. Virgin IslanderUgandanUkrainianUruguayanUteVenezuelanVietnameseWelshWest IndianYakamaYaquiYugoslavianYumanYup'ikZimbabwean
Immigration
NonimmigrantsImmigrantsAfghanistanAfricaAlbaniaArgentinaArmeniaAsiaAustraliaAustriaBahamasBangladeshBarbadosBelarusBelgiumBelizeBoliviaBosnia and HerzegovinaBrazilBulgariaBurma/MyanmarCabo VerdeCambodiaCameroonCanadaCaribbeanCentral AmericaChileChinaColombiaCongoCosta RicaCroatiaCubaCzechoslovakiaDenmarkDominicaDominican RepublicEastern AfricaEastern AsiaEastern EuropeEcuadorEgyptEl SalvadorEnglandEritreaEthiopiaEuropeFijiFranceGermanyGhanaGreeceGrenadaGuatemalaGuyanaHaitiHondurasHong KongHungaryIndiaIndonesiaIranIraqIrelandIsraelItalyJamaicaJapanJordanKazakhstanKenyaKoreaKuwaitLaosLatin AmericaLatviaLebanonLiberiaLithuaniaMalaysiaMexicoMicronesiaMiddle AfricaMoldovaMoroccoNepalNetherlandsNicaraguaNigeriaNorth AmericaNorth MacedoniaNorthern AfricaNorthern EuropeNorwayOceaniaPakistanPanamaPeruPhilippinesPolandPortugalRomaniaRussiaSaudi ArabiaScotlandSenegalSerbiaSierra LeoneSingaporeSomaliaSouth AfricaSouth AmericaSouth Central AsiaSouth Eastern AsiaSouthern EuropeSpainSri LankaSt. Vincent and the GrenadinesSudanSwedenSwitzerlandSyriaTaiwanThailandTrinidad and TobagoTurkeyUgandaUkraineUruguayUzbekistanVenezuelaVietnamWest IndiesWestern AfricaWestern AsiaWestern EuropeYemenZaireZimbabweAzores
Child Poverty Among Boys Under 16
Income
Poverty
Unemployment
Labor Participation
Family Structure
Vehicle Availability
Education Level
Disability

Child Poverty Among Boys Under 16 Comparison

Belgians

Poles

Exceptional
Exceptional
15.2%
CHILD POVERTY AMONG BOYS UNDER 16
93.1/ 100
METRIC RATING
119th/ 347
METRIC RANK
14.4%
CHILD POVERTY AMONG BOYS UNDER 16
98.9/ 100
METRIC RATING
57th/ 347
METRIC RANK

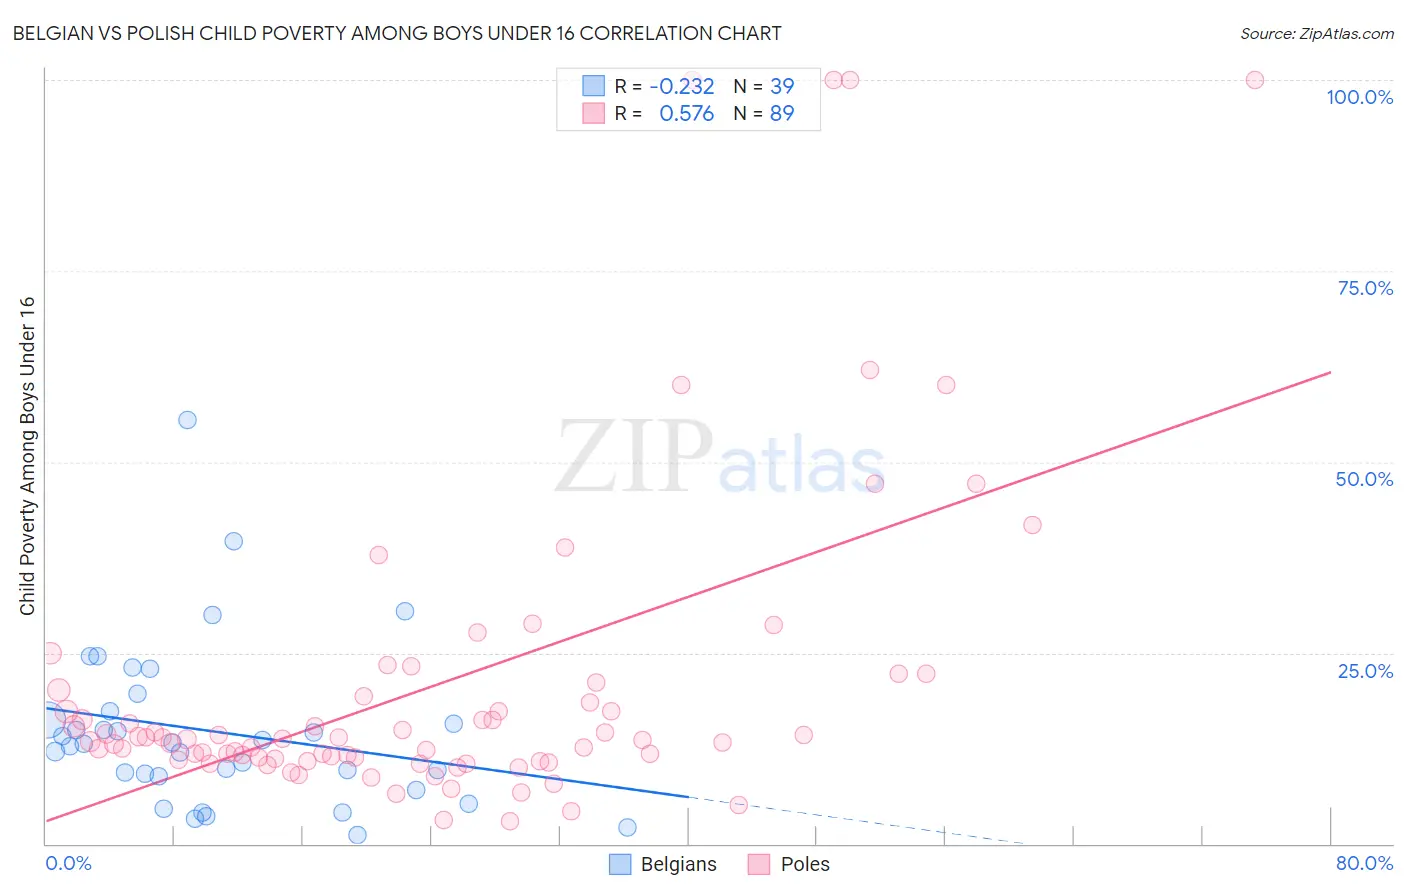
Belgian vs Polish Child Poverty Among Boys Under 16 Correlation Chart

The statistical analysis conducted on geographies consisting of 349,253,372 people shows a weak negative correlation between the proportion of Belgians and poverty level among boys under the age of 16 in the United States with a correlation coefficient (R) of -0.232 and weighted average of 15.2%. Similarly, the statistical analysis conducted on geographies consisting of 540,182,984 people shows a substantial positive correlation between the proportion of Poles and poverty level among boys under the age of 16 in the United States with a correlation coefficient (R) of 0.576 and weighted average of 14.4%, a difference of 6.1%.
Belgian vs Polish Child Poverty Among Boys Under 16

Child Poverty Among Boys Under 16 Correlation Summary

MeasurementBelgianPolish
Minimum1.2%2.9%
Maximum55.4%100.0%
Range54.2%97.1%
Mean14.7%20.7%
Median13.0%13.7%
Interquartile 25% (IQ1)8.8%11.0%
Interquartile 75% (IQ3)17.4%19.7%
Interquartile Range (IQR)8.6%8.7%
Standard Deviation (Sample)10.8%20.9%
Standard Deviation (Population)10.6%20.8%

Similar Demographics by Child Poverty Among Boys Under 16

Demographics Similar to Belgians by Child Poverty Among Boys Under 16

In terms of child poverty among boys under 16, the demographic groups most similar to Belgians are South African (15.2%, a difference of 0.050%), Scottish (15.2%, a difference of 0.060%), Native Hawaiian (15.2%, a difference of 0.12%), Immigrants from Malaysia (15.3%, a difference of 0.16%), and Immigrants from Vietnam (15.2%, a difference of 0.18%).
DemographicsRating | RankChild Poverty Among Boys Under 16
Basques
93.8
/100
|
#112
Exceptional
15.2%
Irish
93.8
/100
|
#113
Exceptional
15.2%
Immigrants | Ukraine
93.6
/100
|
#114
Exceptional
15.2%
Armenians
93.6
/100
|
#115
Exceptional
15.2%
Immigrants | South Eastern Asia
93.5
/100
|
#116
Exceptional
15.2%
Immigrants | Vietnam
93.5
/100
|
#117
Exceptional
15.2%
Native Hawaiians
93.4
/100
|
#118
Exceptional
15.2%
Belgians
93.1
/100
|
#119
Exceptional
15.2%
South Africans
93.0
/100
|
#120
Exceptional
15.2%
Scottish
93.0
/100
|
#121
Exceptional
15.2%
Immigrants | Malaysia
92.8
/100
|
#122
Exceptional
15.3%
Immigrants | Norway
92.3
/100
|
#123
Exceptional
15.3%
Tlingit-Haida
92.2
/100
|
#124
Exceptional
15.3%
Czechoslovakians
92.1
/100
|
#125
Exceptional
15.3%
Palestinians
91.3
/100
|
#126
Exceptional
15.4%

Demographics Similar to Poles by Child Poverty Among Boys Under 16

In terms of child poverty among boys under 16, the demographic groups most similar to Poles are Immigrants from Sweden (14.4%, a difference of 0.080%), Zimbabwean (14.3%, a difference of 0.10%), Immigrants from Czechoslovakia (14.4%, a difference of 0.10%), Immigrants from Pakistan (14.3%, a difference of 0.11%), and Immigrants from Belgium (14.4%, a difference of 0.12%).
DemographicsRating | RankChild Poverty Among Boys Under 16
Italians
99.2
/100
|
#50
Exceptional
14.2%
Immigrants | Greece
99.2
/100
|
#51
Exceptional
14.2%
Laotians
99.0
/100
|
#52
Exceptional
14.3%
Immigrants | Philippines
99.0
/100
|
#53
Exceptional
14.3%
Immigrants | Serbia
99.0
/100
|
#54
Exceptional
14.3%
Immigrants | Pakistan
99.0
/100
|
#55
Exceptional
14.3%
Zimbabweans
99.0
/100
|
#56
Exceptional
14.3%
Poles
98.9
/100
|
#57
Exceptional
14.4%
Immigrants | Sweden
98.9
/100
|
#58
Exceptional
14.4%
Immigrants | Czechoslovakia
98.9
/100
|
#59
Exceptional
14.4%
Immigrants | Belgium
98.9
/100
|
#60
Exceptional
14.4%
Scandinavians
98.8
/100
|
#61
Exceptional
14.4%
Immigrants | Israel
98.7
/100
|
#62
Exceptional
14.4%
Cambodians
98.5
/100
|
#63
Exceptional
14.5%
Immigrants | Romania
98.5
/100
|
#64
Exceptional
14.5%