Belgian vs English Unemployment Among Ages 30 to 34 years
COMPARE
Belgian
English
Unemployment Among Ages 30 to 34 years
Unemployment Among Ages 30 to 34 years Comparison
Belgians
English
5.1%
UNEMPLOYMENT AMONG AGES 30 TO 34 YEARS
97.0/ 100
METRIC RATING
63rd/ 347
METRIC RANK
5.4%
UNEMPLOYMENT AMONG AGES 30 TO 34 YEARS
54.8/ 100
METRIC RATING
167th/ 347
METRIC RANK
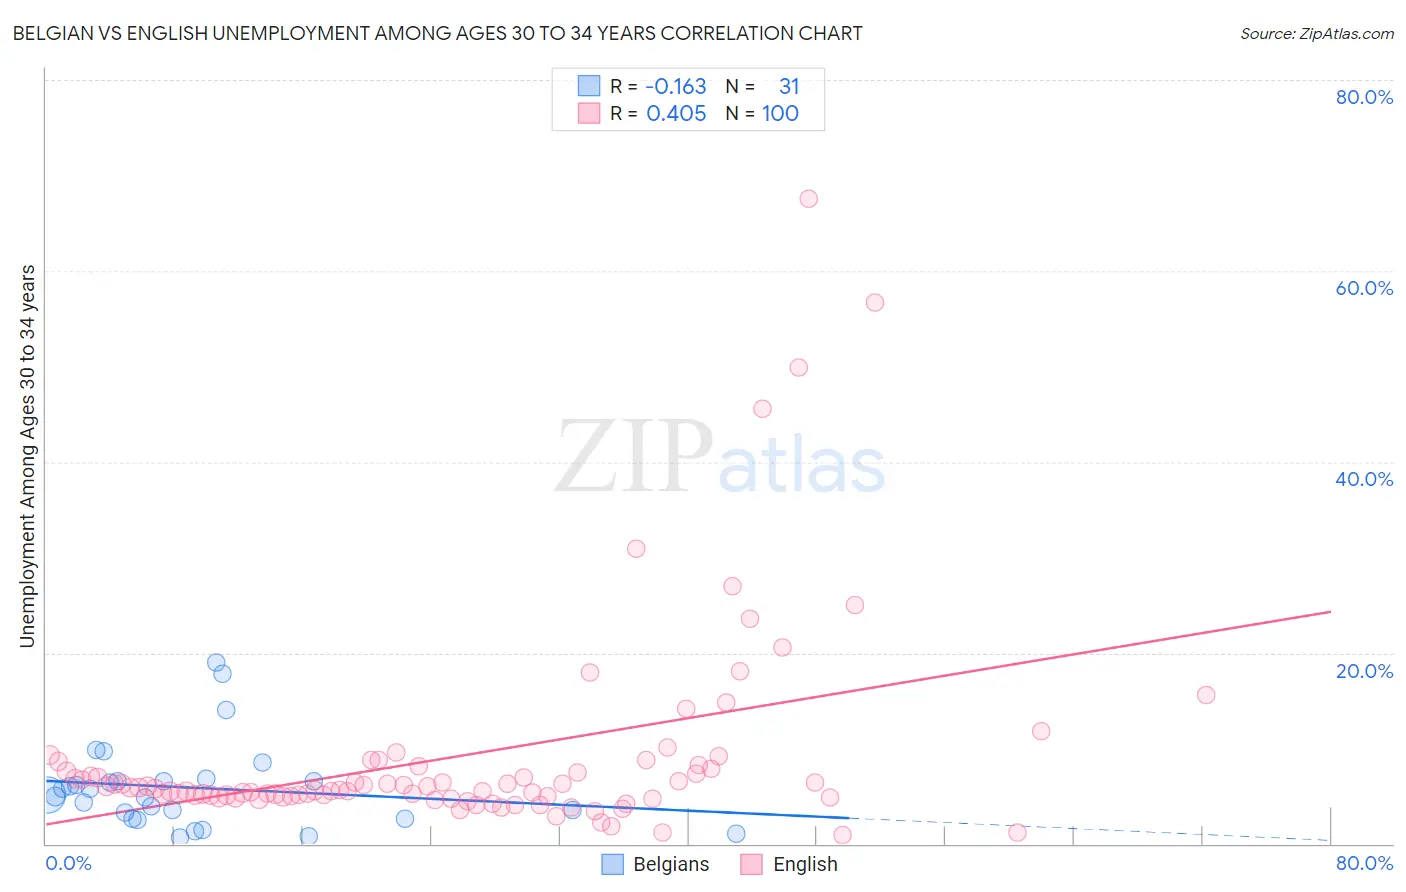
Belgian vs English Unemployment Among Ages 30 to 34 years Correlation Chart
The statistical analysis conducted on geographies consisting of 331,556,880 people shows a poor negative correlation between the proportion of Belgians and unemployment rate among population between the ages 30 and 34 in the United States with a correlation coefficient (R) of -0.163 and weighted average of 5.1%. Similarly, the statistical analysis conducted on geographies consisting of 501,521,473 people shows a moderate positive correlation between the proportion of English and unemployment rate among population between the ages 30 and 34 in the United States with a correlation coefficient (R) of 0.405 and weighted average of 5.4%, a difference of 6.0%.
Unemployment Among Ages 30 to 34 years Correlation Summary
| Measurement | Belgian | English |
| Minimum | 0.60% | 0.90% |
| Maximum | 19.0% | 67.6% |
| Range | 18.4% | 66.7% |
| Mean | 5.9% | 9.2% |
| Median | 5.2% | 5.8% |
| Interquartile 25% (IQ1) | 2.6% | 4.9% |
| Interquartile 75% (IQ3) | 6.6% | 8.0% |
| Interquartile Range (IQR) | 4.0% | 3.0% |
| Standard Deviation (Sample) | 4.5% | 10.8% |
| Standard Deviation (Population) | 4.4% | 10.8% |
Similar Demographics by Unemployment Among Ages 30 to 34 years
Demographics Similar to Belgians by Unemployment Among Ages 30 to 34 years
In terms of unemployment among ages 30 to 34 years, the demographic groups most similar to Belgians are Immigrants from France (5.1%, a difference of 0.010%), Immigrants from Eastern Asia (5.1%, a difference of 0.020%), Indian (Asian) (5.1%, a difference of 0.030%), Swedish (5.1%, a difference of 0.060%), and Immigrants from Somalia (5.1%, a difference of 0.060%).
| Demographics | Rating | Rank | Unemployment Among Ages 30 to 34 years |
| Immigrants | Serbia | 97.4 /100 | #56 | Exceptional 5.1% |
| Immigrants | China | 97.2 /100 | #57 | Exceptional 5.1% |
| Asians | 97.2 /100 | #58 | Exceptional 5.1% |
| Swedes | 97.1 /100 | #59 | Exceptional 5.1% |
| Immigrants | Somalia | 97.1 /100 | #60 | Exceptional 5.1% |
| Indians (Asian) | 97.0 /100 | #61 | Exceptional 5.1% |
| Immigrants | France | 97.0 /100 | #62 | Exceptional 5.1% |
| Belgians | 97.0 /100 | #63 | Exceptional 5.1% |
| Immigrants | Eastern Asia | 96.9 /100 | #64 | Exceptional 5.1% |
| Immigrants | Japan | 96.8 /100 | #65 | Exceptional 5.1% |
| Immigrants | Zimbabwe | 96.7 /100 | #66 | Exceptional 5.1% |
| Burmese | 96.5 /100 | #67 | Exceptional 5.1% |
| Jordanians | 96.5 /100 | #68 | Exceptional 5.1% |
| Immigrants | Northern Africa | 96.4 /100 | #69 | Exceptional 5.1% |
| Immigrants | Iraq | 96.4 /100 | #70 | Exceptional 5.1% |
Demographics Similar to English by Unemployment Among Ages 30 to 34 years
In terms of unemployment among ages 30 to 34 years, the demographic groups most similar to English are Immigrants from Thailand (5.4%, a difference of 0.050%), Welsh (5.4%, a difference of 0.11%), South American (5.4%, a difference of 0.13%), Immigrants from Israel (5.4%, a difference of 0.14%), and Dutch (5.5%, a difference of 0.15%).
| Demographics | Rating | Rank | Unemployment Among Ages 30 to 34 years |
| Immigrants | Scotland | 59.3 /100 | #160 | Average 5.4% |
| Austrians | 59.0 /100 | #161 | Average 5.4% |
| Brazilians | 58.2 /100 | #162 | Average 5.4% |
| Arabs | 57.7 /100 | #163 | Average 5.4% |
| Basques | 57.3 /100 | #164 | Average 5.4% |
| Welsh | 56.3 /100 | #165 | Average 5.4% |
| Immigrants | Thailand | 55.6 /100 | #166 | Average 5.4% |
| English | 54.8 /100 | #167 | Average 5.4% |
| South Americans | 52.9 /100 | #168 | Average 5.4% |
| Immigrants | Israel | 52.9 /100 | #169 | Average 5.4% |
| Dutch | 52.6 /100 | #170 | Average 5.5% |
| Scottish | 51.8 /100 | #171 | Average 5.5% |
| Immigrants | Austria | 51.3 /100 | #172 | Average 5.5% |
| Peruvians | 50.2 /100 | #173 | Average 5.5% |
| Immigrants | Laos | 50.0 /100 | #174 | Average 5.5% |