Belgian vs English Disability Age 65 to 74
COMPARE
Belgian
English
Disability Age 65 to 74
Disability Age 65 to 74 Comparison
Belgians
English
22.7%
DISABILITY AGE 65 TO 74
85.3/ 100
METRIC RATING
141st/ 347
METRIC RANK
23.6%
DISABILITY AGE 65 TO 74
28.5/ 100
METRIC RATING
193rd/ 347
METRIC RANK
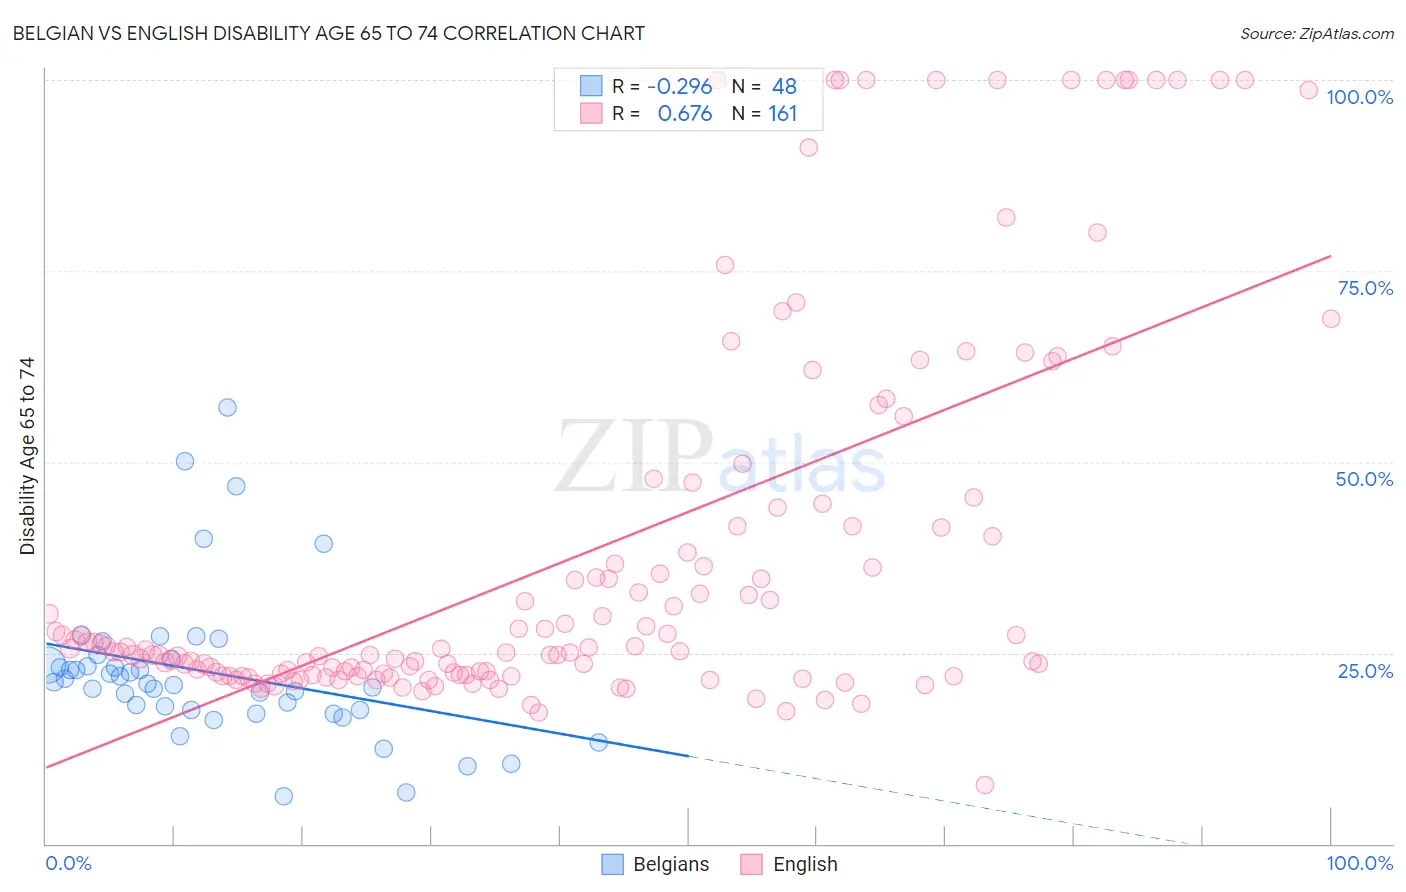
Belgian vs English Disability Age 65 to 74 Correlation Chart
The statistical analysis conducted on geographies consisting of 355,442,637 people shows a weak negative correlation between the proportion of Belgians and percentage of population with a disability between the ages 65 and 75 in the United States with a correlation coefficient (R) of -0.296 and weighted average of 22.7%. Similarly, the statistical analysis conducted on geographies consisting of 576,788,305 people shows a significant positive correlation between the proportion of English and percentage of population with a disability between the ages 65 and 75 in the United States with a correlation coefficient (R) of 0.676 and weighted average of 23.6%, a difference of 4.0%.
Disability Age 65 to 74 Correlation Summary
| Measurement | Belgian | English |
| Minimum | 6.1% | 7.7% |
| Maximum | 57.1% | 100.0% |
| Range | 51.0% | 92.3% |
| Mean | 22.5% | 37.7% |
| Median | 21.0% | 25.2% |
| Interquartile 25% (IQ1) | 17.5% | 22.1% |
| Interquartile 75% (IQ3) | 23.8% | 41.6% |
| Interquartile Range (IQR) | 6.3% | 19.4% |
| Standard Deviation (Sample) | 9.9% | 24.9% |
| Standard Deviation (Population) | 9.8% | 24.8% |
Similar Demographics by Disability Age 65 to 74
Demographics Similar to Belgians by Disability Age 65 to 74
In terms of disability age 65 to 74, the demographic groups most similar to Belgians are Ugandan (22.7%, a difference of 0.010%), Immigrants from Ethiopia (22.7%, a difference of 0.010%), Immigrants from Syria (22.7%, a difference of 0.050%), Arab (22.8%, a difference of 0.070%), and Danish (22.8%, a difference of 0.11%).
| Demographics | Rating | Rank | Disability Age 65 to 74 |
| Afghans | 88.6 /100 | #134 | Excellent 22.6% |
| Immigrants | Ukraine | 88.4 /100 | #135 | Excellent 22.6% |
| Ethiopians | 87.9 /100 | #136 | Excellent 22.7% |
| Taiwanese | 87.6 /100 | #137 | Excellent 22.7% |
| Immigrants | Moldova | 87.3 /100 | #138 | Excellent 22.7% |
| Immigrants | Syria | 85.8 /100 | #139 | Excellent 22.7% |
| Ugandans | 85.4 /100 | #140 | Excellent 22.7% |
| Belgians | 85.3 /100 | #141 | Excellent 22.7% |
| Immigrants | Ethiopia | 85.3 /100 | #142 | Excellent 22.7% |
| Arabs | 84.8 /100 | #143 | Excellent 22.8% |
| Danes | 84.4 /100 | #144 | Excellent 22.8% |
| Immigrants | Uganda | 84.0 /100 | #145 | Excellent 22.8% |
| Alsatians | 83.7 /100 | #146 | Excellent 22.8% |
| Immigrants | Uzbekistan | 83.1 /100 | #147 | Excellent 22.8% |
| New Zealanders | 79.9 /100 | #148 | Good 22.9% |
Demographics Similar to English by Disability Age 65 to 74
In terms of disability age 65 to 74, the demographic groups most similar to English are Sudanese (23.7%, a difference of 0.050%), Ecuadorian (23.6%, a difference of 0.080%), Immigrants from Bangladesh (23.6%, a difference of 0.12%), Immigrants from St. Vincent and the Grenadines (23.7%, a difference of 0.18%), and Immigrants from Trinidad and Tobago (23.7%, a difference of 0.18%).
| Demographics | Rating | Rank | Disability Age 65 to 74 |
| Basques | 38.4 /100 | #186 | Fair 23.5% |
| Portuguese | 37.8 /100 | #187 | Fair 23.5% |
| Immigrants | Cuba | 34.0 /100 | #188 | Fair 23.6% |
| Scottish | 33.1 /100 | #189 | Fair 23.6% |
| Immigrants | Guyana | 31.2 /100 | #190 | Fair 23.6% |
| Immigrants | Bangladesh | 30.2 /100 | #191 | Fair 23.6% |
| Ecuadorians | 29.7 /100 | #192 | Fair 23.6% |
| English | 28.5 /100 | #193 | Fair 23.6% |
| Sudanese | 27.8 /100 | #194 | Fair 23.7% |
| Immigrants | St. Vincent and the Grenadines | 26.1 /100 | #195 | Fair 23.7% |
| Immigrants | Trinidad and Tobago | 26.1 /100 | #196 | Fair 23.7% |
| Immigrants | Immigrants | 25.8 /100 | #197 | Fair 23.7% |
| Immigrants | Africa | 24.4 /100 | #198 | Fair 23.7% |
| Welsh | 24.3 /100 | #199 | Fair 23.7% |
| French Canadians | 24.0 /100 | #200 | Fair 23.7% |