Basque vs Immigrants from Panama Female Unemployment

COMPARE

Basque
Race
Ancestry
AfghanAfricanAlaska NativeAlaskan AthabascanAlbanianAleutAlsatianAmericanApacheArabArapahoArgentineanArmenianAssyrian/Chaldean/SyriacAustralianAustrianBahamianBangladeshiBarbadianBasqueBelgianBelizeanBermudanBhutaneseBlackfeetBolivianBrazilianBritishBritish West IndianBulgarianBurmeseCajunCambodianCanadianCape VerdeanCarpatho RusynCelticCentral AmericanCentral American IndianCherokeeCheyenneChickasawChileanChineseChippewaChoctawColombianColvilleComancheCosta RicanCreeCreekCroatianCrowCubanCypriotCzechCzechoslovakianDanishDelawareDominicanDutchDutch West IndianEastern EuropeanEcuadorianEgyptianEnglishEstonianEthiopianEuropeanFijianFilipinoFinnishFrenchFrench American IndianFrench CanadianGermanGerman RussianGhanaianGreekGuamanian/ChamorroGuatemalanGuyaneseHaitianHmongHonduranHopiHoumaHungarianIcelanderIndian (Asian)IndonesianInupiatIranianIraqiIrishIroquoisIsraeliItalianJamaicanJapaneseJordanianKenyanKiowaKoreanLaotianLatvianLebaneseLiberianLithuanianLumbeeLuxembourgerMacedonianMalaysianMalteseMarshalleseMenomineeMexicanMexican American IndianMongolianMoroccanNative HawaiianNavajoNepaleseNew ZealanderNicaraguanNigerianNorthern EuropeanNorwegianOkinawanOsageOttawaPaiutePakistaniPalestinianPanamanianParaguayanPennsylvania GermanPeruvianPimaPolishPortuguesePotawatomiPuebloPuerto RicanPuget Sound SalishRomanianRussianSalvadoranSamoanScandinavianScotch-IrishScottishSeminoleSenegaleseSerbianShoshoneSierra LeoneanSiouxSlavicSlovakSloveneSomaliSouth AfricanSouth AmericanSouth American IndianSoviet UnionSpaniardSpanishSpanish AmericanSpanish American IndianSri LankanSubsaharan AfricanSudaneseSwedishSwissSyrianTaiwaneseThaiTlingit-HaidaTohono O'OdhamTonganTrinidadian and TobagonianTsimshianTurkishU.S. Virgin IslanderUgandanUkrainianUruguayanUteVenezuelanVietnameseWelshWest IndianYakamaYaquiYugoslavianYumanYup'ikZimbabwean
Immigration
NonimmigrantsImmigrantsAfghanistanAfricaAlbaniaArgentinaArmeniaAsiaAustraliaAustriaBahamasBangladeshBarbadosBelarusBelgiumBelizeBoliviaBosnia and HerzegovinaBrazilBulgariaBurma/MyanmarCabo VerdeCambodiaCameroonCanadaCaribbeanCentral AmericaChileChinaColombiaCongoCosta RicaCroatiaCubaCzechoslovakiaDenmarkDominicaDominican RepublicEastern AfricaEastern AsiaEastern EuropeEcuadorEgyptEl SalvadorEnglandEritreaEthiopiaEuropeFijiFranceGermanyGhanaGreeceGrenadaGuatemalaGuyanaHaitiHondurasHong KongHungaryIndiaIndonesiaIranIraqIrelandIsraelItalyJamaicaJapanJordanKazakhstanKenyaKoreaKuwaitLaosLatin AmericaLatviaLebanonLiberiaLithuaniaMalaysiaMexicoMicronesiaMiddle AfricaMoldovaMoroccoNepalNetherlandsNicaraguaNigeriaNorth AmericaNorth MacedoniaNorthern AfricaNorthern EuropeNorwayOceaniaPakistanPeruPhilippinesPolandPortugalRomaniaRussiaSaudi ArabiaScotlandSenegalSerbiaSierra LeoneSingaporeSomaliaSouth AfricaSouth AmericaSouth Central AsiaSouth Eastern AsiaSouthern EuropeSpainSri LankaSt. Vincent and the GrenadinesSudanSwedenSwitzerlandSyriaTaiwanThailandTrinidad and TobagoTurkeyUgandaUkraineUruguayUzbekistanVenezuelaVietnamWest IndiesWestern AfricaWestern AsiaWestern EuropeYemenZaireZimbabweAzores
Immigrants from Panama
Race
Ancestry
AfghanAfricanAlaska NativeAlaskan AthabascanAlbanianAleutAlsatianAmericanApacheArabArapahoArgentineanArmenianAssyrian/Chaldean/SyriacAustralianAustrianBahamianBangladeshiBarbadianBelgianBelizeanBermudanBhutaneseBlackfeetBolivianBrazilianBritishBritish West IndianBulgarianBurmeseCajunCambodianCanadianCape VerdeanCarpatho RusynCelticCentral AmericanCentral American IndianCherokeeCheyenneChickasawChileanChineseChippewaChoctawColombianColvilleComancheCosta RicanCreeCreekCroatianCrowCubanCypriotCzechCzechoslovakianDanishDelawareDominicanDutchDutch West IndianEastern EuropeanEcuadorianEgyptianEnglishEstonianEthiopianEuropeanFijianFilipinoFinnishFrenchFrench American IndianFrench CanadianGermanGerman RussianGhanaianGreekGuamanian/ChamorroGuatemalanGuyaneseHaitianHmongHonduranHopiHoumaHungarianIcelanderIndian (Asian)IndonesianInupiatIranianIraqiIrishIroquoisIsraeliItalianJamaicanJapaneseJordanianKenyanKiowaKoreanLaotianLatvianLebaneseLiberianLithuanianLumbeeLuxembourgerMacedonianMalaysianMalteseMarshalleseMenomineeMexicanMexican American IndianMongolianMoroccanNative HawaiianNavajoNepaleseNew ZealanderNicaraguanNigerianNorthern EuropeanNorwegianOkinawanOsageOttawaPaiutePakistaniPalestinianPanamanianParaguayanPennsylvania GermanPeruvianPimaPolishPortuguesePotawatomiPuebloPuerto RicanPuget Sound SalishRomanianRussianSalvadoranSamoanScandinavianScotch-IrishScottishSeminoleSenegaleseSerbianShoshoneSierra LeoneanSiouxSlavicSlovakSloveneSomaliSouth AfricanSouth AmericanSouth American IndianSoviet UnionSpaniardSpanishSpanish AmericanSpanish American IndianSri LankanSubsaharan AfricanSudaneseSwedishSwissSyrianTaiwaneseThaiTlingit-HaidaTohono O'OdhamTonganTrinidadian and TobagonianTsimshianTurkishU.S. Virgin IslanderUgandanUkrainianUruguayanUteVenezuelanVietnameseWelshWest IndianYakamaYaquiYugoslavianYumanYup'ikZimbabwean
Immigration
NonimmigrantsImmigrantsAfghanistanAfricaAlbaniaArgentinaArmeniaAsiaAustraliaAustriaBahamasBangladeshBarbadosBelarusBelgiumBelizeBoliviaBosnia and HerzegovinaBrazilBulgariaBurma/MyanmarCabo VerdeCambodiaCameroonCanadaCaribbeanCentral AmericaChileChinaColombiaCongoCosta RicaCroatiaCubaCzechoslovakiaDenmarkDominicaDominican RepublicEastern AfricaEastern AsiaEastern EuropeEcuadorEgyptEl SalvadorEnglandEritreaEthiopiaEuropeFijiFranceGermanyGhanaGreeceGrenadaGuatemalaGuyanaHaitiHondurasHong KongHungaryIndiaIndonesiaIranIraqIrelandIsraelItalyJamaicaJapanJordanKazakhstanKenyaKoreaKuwaitLaosLatin AmericaLatviaLebanonLiberiaLithuaniaMalaysiaMexicoMicronesiaMiddle AfricaMoldovaMoroccoNepalNetherlandsNicaraguaNigeriaNorth AmericaNorth MacedoniaNorthern AfricaNorthern EuropeNorwayOceaniaPakistanPanamaPeruPhilippinesPolandPortugalRomaniaRussiaSaudi ArabiaScotlandSenegalSerbiaSierra LeoneSingaporeSomaliaSouth AfricaSouth AmericaSouth Central AsiaSouth Eastern AsiaSouthern EuropeSpainSri LankaSt. Vincent and the GrenadinesSudanSwedenSwitzerlandSyriaTaiwanThailandTrinidad and TobagoTurkeyUgandaUkraineUruguayUzbekistanVenezuelaVietnamWest IndiesWestern AfricaWestern AsiaWestern EuropeYemenZaireZimbabweAzores
Female Unemployment
Income
Poverty
Unemployment
Labor Participation
Family Structure
Vehicle Availability
Education Level
Disability

Female Unemployment Comparison

Basques

Immigrants from Panama

Excellent
Tragic
5.1%
FEMALE UNEMPLOYMENT
86.5/ 100
METRIC RATING
125th/ 347
METRIC RANK
5.5%
FEMALE UNEMPLOYMENT
3.2/ 100
METRIC RATING
237th/ 347
METRIC RANK

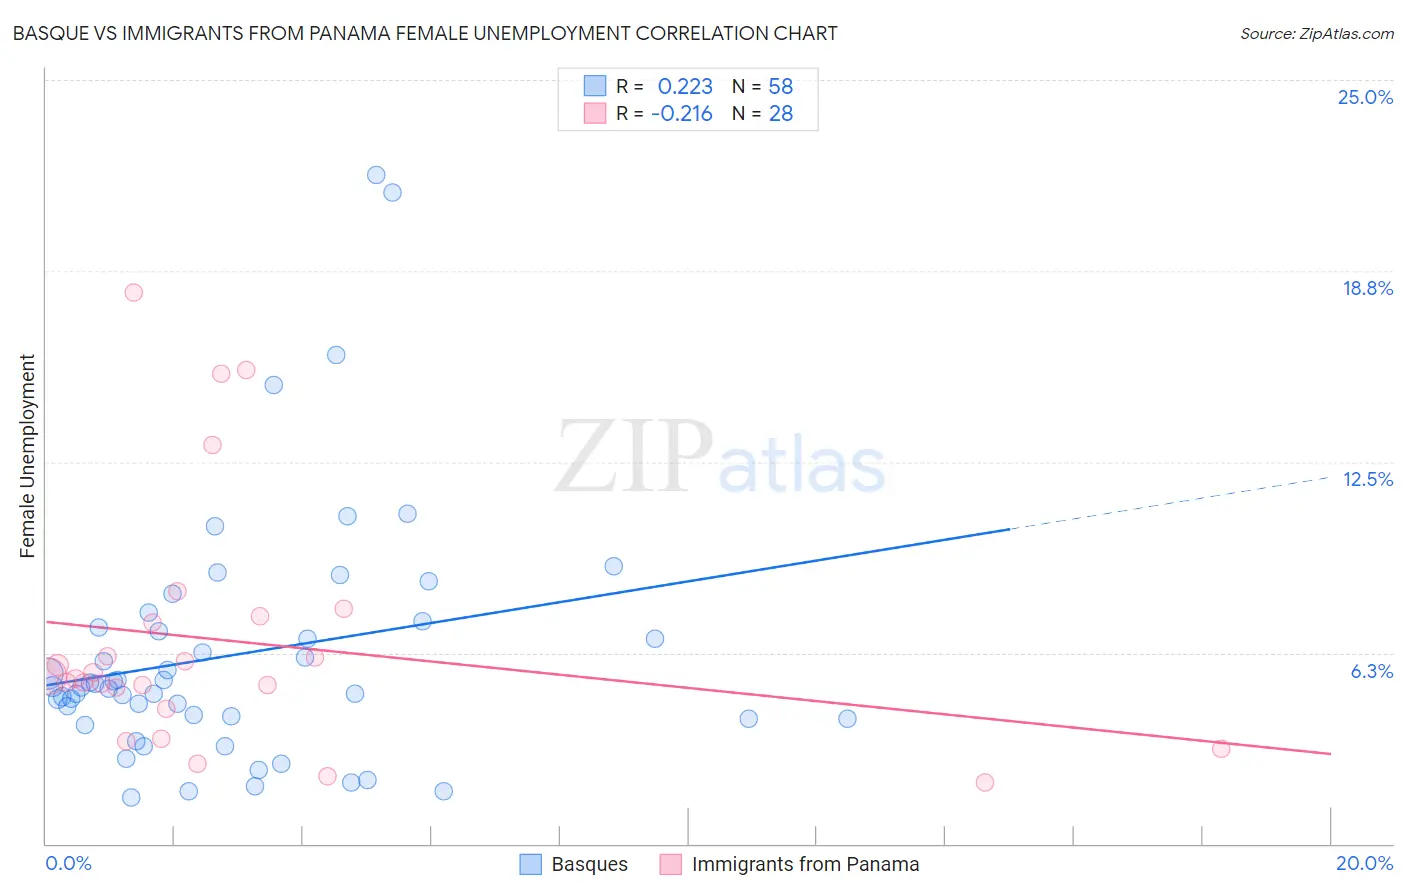
Basque vs Immigrants from Panama Female Unemployment Correlation Chart

The statistical analysis conducted on geographies consisting of 165,405,269 people shows a weak positive correlation between the proportion of Basques and unemploymnet rate among females in the United States with a correlation coefficient (R) of 0.223 and weighted average of 5.1%. Similarly, the statistical analysis conducted on geographies consisting of 220,928,919 people shows a weak negative correlation between the proportion of Immigrants from Panama and unemploymnet rate among females in the United States with a correlation coefficient (R) of -0.216 and weighted average of 5.5%, a difference of 8.1%.
Basque vs Immigrants from Panama Female Unemployment

Female Unemployment Correlation Summary

MeasurementBasqueImmigrants from Panama
Minimum1.5%2.0%
Maximum21.9%18.0%
Range20.4%16.0%
Mean6.2%6.6%
Median5.1%5.4%
Interquartile 25% (IQ1)4.1%4.8%
Interquartile 75% (IQ3)7.1%7.3%
Interquartile Range (IQR)3.0%2.6%
Standard Deviation (Sample)4.1%4.1%
Standard Deviation (Population)4.1%4.0%

Similar Demographics by Female Unemployment

Demographics Similar to Basques by Female Unemployment

In terms of female unemployment, the demographic groups most similar to Basques are Immigrants from Korea (5.1%, a difference of 0.020%), Immigrants from Hungary (5.1%, a difference of 0.060%), Chilean (5.1%, a difference of 0.090%), Immigrants from Europe (5.1%, a difference of 0.10%), and Ethiopian (5.1%, a difference of 0.10%).
DemographicsRating | RankFemale Unemployment
Immigrants | Croatia
89.9
/100
|
#118
Excellent
5.1%
Immigrants | North Macedonia
88.3
/100
|
#119
Excellent
5.1%
Immigrants | Romania
88.1
/100
|
#120
Excellent
5.1%
Immigrants | Western Europe
88.1
/100
|
#121
Excellent
5.1%
Immigrants | Germany
87.6
/100
|
#122
Excellent
5.1%
Immigrants | South Africa
87.6
/100
|
#123
Excellent
5.1%
Immigrants | Europe
87.2
/100
|
#124
Excellent
5.1%
Basques
86.5
/100
|
#125
Excellent
5.1%
Immigrants | Korea
86.3
/100
|
#126
Excellent
5.1%
Immigrants | Hungary
86.0
/100
|
#127
Excellent
5.1%
Chileans
85.8
/100
|
#128
Excellent
5.1%
Ethiopians
85.7
/100
|
#129
Excellent
5.1%
Maltese
85.5
/100
|
#130
Excellent
5.1%
Immigrants | Ethiopia
85.4
/100
|
#131
Excellent
5.1%
Immigrants | Sri Lanka
85.0
/100
|
#132
Excellent
5.1%

Demographics Similar to Immigrants from Panama by Female Unemployment

In terms of female unemployment, the demographic groups most similar to Immigrants from Panama are Immigrants from Cambodia (5.5%, a difference of 0.020%), Sierra Leonean (5.5%, a difference of 0.020%), Immigrants from Lebanon (5.5%, a difference of 0.060%), Immigrants from Iran (5.5%, a difference of 0.060%), and Moroccan (5.5%, a difference of 0.080%).
DemographicsRating | RankFemale Unemployment
Immigrants | Uruguay
4.7
/100
|
#230
Tragic
5.5%
Immigrants | Iraq
3.9
/100
|
#231
Tragic
5.5%
Liberians
3.9
/100
|
#232
Tragic
5.5%
Moroccans
3.4
/100
|
#233
Tragic
5.5%
Immigrants | Lebanon
3.3
/100
|
#234
Tragic
5.5%
Immigrants | Iran
3.3
/100
|
#235
Tragic
5.5%
Immigrants | Cambodia
3.3
/100
|
#236
Tragic
5.5%
Immigrants | Panama
3.2
/100
|
#237
Tragic
5.5%
Sierra Leoneans
3.2
/100
|
#238
Tragic
5.5%
Aleuts
3.0
/100
|
#239
Tragic
5.5%
Immigrants | South America
2.9
/100
|
#240
Tragic
5.5%
South American Indians
2.8
/100
|
#241
Tragic
5.5%
Marshallese
2.3
/100
|
#242
Tragic
5.6%
Spanish Americans
2.2
/100
|
#243
Tragic
5.6%
Immigrants | Liberia
1.5
/100
|
#244
Tragic
5.6%