Basque vs Immigrants from Albania Female Unemployment

COMPARE

Basque
Race
Ancestry
AfghanAfricanAlaska NativeAlaskan AthabascanAlbanianAleutAlsatianAmericanApacheArabArapahoArgentineanArmenianAssyrian/Chaldean/SyriacAustralianAustrianBahamianBangladeshiBarbadianBasqueBelgianBelizeanBermudanBhutaneseBlackfeetBolivianBrazilianBritishBritish West IndianBulgarianBurmeseCajunCambodianCanadianCape VerdeanCarpatho RusynCelticCentral AmericanCentral American IndianCherokeeCheyenneChickasawChileanChineseChippewaChoctawColombianColvilleComancheCosta RicanCreeCreekCroatianCrowCubanCypriotCzechCzechoslovakianDanishDelawareDominicanDutchDutch West IndianEastern EuropeanEcuadorianEgyptianEnglishEstonianEthiopianEuropeanFijianFilipinoFinnishFrenchFrench American IndianFrench CanadianGermanGerman RussianGhanaianGreekGuamanian/ChamorroGuatemalanGuyaneseHaitianHmongHonduranHopiHoumaHungarianIcelanderIndian (Asian)IndonesianInupiatIranianIraqiIrishIroquoisIsraeliItalianJamaicanJapaneseJordanianKenyanKiowaKoreanLaotianLatvianLebaneseLiberianLithuanianLumbeeLuxembourgerMacedonianMalaysianMalteseMarshalleseMenomineeMexicanMexican American IndianMongolianMoroccanNative HawaiianNavajoNepaleseNew ZealanderNicaraguanNigerianNorthern EuropeanNorwegianOkinawanOsageOttawaPaiutePakistaniPalestinianPanamanianParaguayanPennsylvania GermanPeruvianPimaPolishPortuguesePotawatomiPuebloPuerto RicanPuget Sound SalishRomanianRussianSalvadoranSamoanScandinavianScotch-IrishScottishSeminoleSenegaleseSerbianShoshoneSierra LeoneanSiouxSlavicSlovakSloveneSomaliSouth AfricanSouth AmericanSouth American IndianSoviet UnionSpaniardSpanishSpanish AmericanSpanish American IndianSri LankanSubsaharan AfricanSudaneseSwedishSwissSyrianTaiwaneseThaiTlingit-HaidaTohono O'OdhamTonganTrinidadian and TobagonianTsimshianTurkishU.S. Virgin IslanderUgandanUkrainianUruguayanUteVenezuelanVietnameseWelshWest IndianYakamaYaquiYugoslavianYumanYup'ikZimbabwean
Immigration
NonimmigrantsImmigrantsAfghanistanAfricaArgentinaArmeniaAsiaAustraliaAustriaBahamasBangladeshBarbadosBelarusBelgiumBelizeBoliviaBosnia and HerzegovinaBrazilBulgariaBurma/MyanmarCabo VerdeCambodiaCameroonCanadaCaribbeanCentral AmericaChileChinaColombiaCongoCosta RicaCroatiaCubaCzechoslovakiaDenmarkDominicaDominican RepublicEastern AfricaEastern AsiaEastern EuropeEcuadorEgyptEl SalvadorEnglandEritreaEthiopiaEuropeFijiFranceGermanyGhanaGreeceGrenadaGuatemalaGuyanaHaitiHondurasHong KongHungaryIndiaIndonesiaIranIraqIrelandIsraelItalyJamaicaJapanJordanKazakhstanKenyaKoreaKuwaitLaosLatin AmericaLatviaLebanonLiberiaLithuaniaMalaysiaMexicoMicronesiaMiddle AfricaMoldovaMoroccoNepalNetherlandsNicaraguaNigeriaNorth AmericaNorth MacedoniaNorthern AfricaNorthern EuropeNorwayOceaniaPakistanPanamaPeruPhilippinesPolandPortugalRomaniaRussiaSaudi ArabiaScotlandSenegalSerbiaSierra LeoneSingaporeSomaliaSouth AfricaSouth AmericaSouth Central AsiaSouth Eastern AsiaSouthern EuropeSpainSri LankaSt. Vincent and the GrenadinesSudanSwedenSwitzerlandSyriaTaiwanThailandTrinidad and TobagoTurkeyUgandaUkraineUruguayUzbekistanVenezuelaVietnamWest IndiesWestern AfricaWestern AsiaWestern EuropeYemenZaireZimbabweAzores
Immigrants from Albania
Race
Ancestry
AfghanAfricanAlaska NativeAlaskan AthabascanAlbanianAleutAlsatianAmericanApacheArabArapahoArgentineanArmenianAssyrian/Chaldean/SyriacAustralianAustrianBahamianBangladeshiBarbadianBelgianBelizeanBermudanBhutaneseBlackfeetBolivianBrazilianBritishBritish West IndianBulgarianBurmeseCajunCambodianCanadianCape VerdeanCarpatho RusynCelticCentral AmericanCentral American IndianCherokeeCheyenneChickasawChileanChineseChippewaChoctawColombianColvilleComancheCosta RicanCreeCreekCroatianCrowCubanCypriotCzechCzechoslovakianDanishDelawareDominicanDutchDutch West IndianEastern EuropeanEcuadorianEgyptianEnglishEstonianEthiopianEuropeanFijianFilipinoFinnishFrenchFrench American IndianFrench CanadianGermanGerman RussianGhanaianGreekGuamanian/ChamorroGuatemalanGuyaneseHaitianHmongHonduranHopiHoumaHungarianIcelanderIndian (Asian)IndonesianInupiatIranianIraqiIrishIroquoisIsraeliItalianJamaicanJapaneseJordanianKenyanKiowaKoreanLaotianLatvianLebaneseLiberianLithuanianLumbeeLuxembourgerMacedonianMalaysianMalteseMarshalleseMenomineeMexicanMexican American IndianMongolianMoroccanNative HawaiianNavajoNepaleseNew ZealanderNicaraguanNigerianNorthern EuropeanNorwegianOkinawanOsageOttawaPaiutePakistaniPalestinianPanamanianParaguayanPennsylvania GermanPeruvianPimaPolishPortuguesePotawatomiPuebloPuerto RicanPuget Sound SalishRomanianRussianSalvadoranSamoanScandinavianScotch-IrishScottishSeminoleSenegaleseSerbianShoshoneSierra LeoneanSiouxSlavicSlovakSloveneSomaliSouth AfricanSouth AmericanSouth American IndianSoviet UnionSpaniardSpanishSpanish AmericanSpanish American IndianSri LankanSubsaharan AfricanSudaneseSwedishSwissSyrianTaiwaneseThaiTlingit-HaidaTohono O'OdhamTonganTrinidadian and TobagonianTsimshianTurkishU.S. Virgin IslanderUgandanUkrainianUruguayanUteVenezuelanVietnameseWelshWest IndianYakamaYaquiYugoslavianYumanYup'ikZimbabwean
Immigration
NonimmigrantsImmigrantsAfghanistanAfricaAlbaniaArgentinaArmeniaAsiaAustraliaAustriaBahamasBangladeshBarbadosBelarusBelgiumBelizeBoliviaBosnia and HerzegovinaBrazilBulgariaBurma/MyanmarCabo VerdeCambodiaCameroonCanadaCaribbeanCentral AmericaChileChinaColombiaCongoCosta RicaCroatiaCubaCzechoslovakiaDenmarkDominicaDominican RepublicEastern AfricaEastern AsiaEastern EuropeEcuadorEgyptEl SalvadorEnglandEritreaEthiopiaEuropeFijiFranceGermanyGhanaGreeceGrenadaGuatemalaGuyanaHaitiHondurasHong KongHungaryIndiaIndonesiaIranIraqIrelandIsraelItalyJamaicaJapanJordanKazakhstanKenyaKoreaKuwaitLaosLatin AmericaLatviaLebanonLiberiaLithuaniaMalaysiaMexicoMicronesiaMiddle AfricaMoldovaMoroccoNepalNetherlandsNicaraguaNigeriaNorth AmericaNorth MacedoniaNorthern AfricaNorthern EuropeNorwayOceaniaPakistanPanamaPeruPhilippinesPolandPortugalRomaniaRussiaSaudi ArabiaScotlandSenegalSerbiaSierra LeoneSingaporeSomaliaSouth AfricaSouth AmericaSouth Central AsiaSouth Eastern AsiaSouthern EuropeSpainSri LankaSt. Vincent and the GrenadinesSudanSwedenSwitzerlandSyriaTaiwanThailandTrinidad and TobagoTurkeyUgandaUkraineUruguayUzbekistanVenezuelaVietnamWest IndiesWestern AfricaWestern AsiaWestern EuropeYemenZaireZimbabweAzores
Female Unemployment
Income
Poverty
Unemployment
Labor Participation
Family Structure
Vehicle Availability
Education Level
Disability

Female Unemployment Comparison

Basques

Immigrants from Albania

Excellent
Fair
5.1%
FEMALE UNEMPLOYMENT
86.5/ 100
METRIC RATING
125th/ 347
METRIC RANK
5.3%
FEMALE UNEMPLOYMENT
35.4/ 100
METRIC RATING
187th/ 347
METRIC RANK

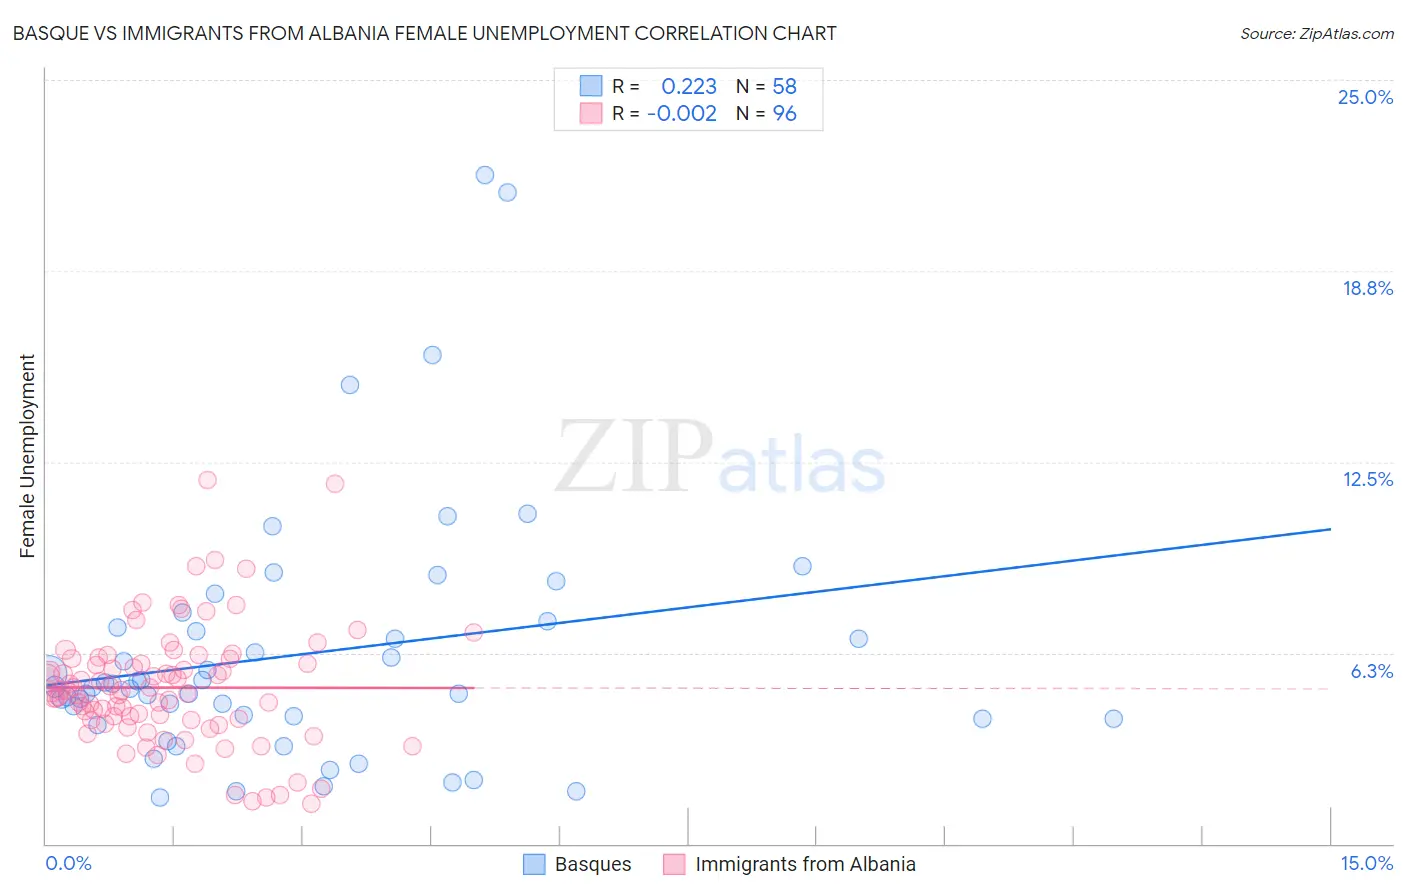
Basque vs Immigrants from Albania Female Unemployment Correlation Chart

The statistical analysis conducted on geographies consisting of 165,405,269 people shows a weak positive correlation between the proportion of Basques and unemploymnet rate among females in the United States with a correlation coefficient (R) of 0.223 and weighted average of 5.1%. Similarly, the statistical analysis conducted on geographies consisting of 119,261,752 people shows no correlation between the proportion of Immigrants from Albania and unemploymnet rate among females in the United States with a correlation coefficient (R) of -0.002 and weighted average of 5.3%, a difference of 3.8%.
Basque vs Immigrants from Albania Female Unemployment

Female Unemployment Correlation Summary

MeasurementBasqueImmigrants from Albania
Minimum1.5%1.3%
Maximum21.9%11.9%
Range20.4%10.6%
Mean6.2%5.1%
Median5.1%5.0%
Interquartile 25% (IQ1)4.1%4.1%
Interquartile 75% (IQ3)7.1%6.0%
Interquartile Range (IQR)3.0%1.9%
Standard Deviation (Sample)4.1%1.9%
Standard Deviation (Population)4.1%1.9%

Similar Demographics by Female Unemployment

Demographics Similar to Basques by Female Unemployment

In terms of female unemployment, the demographic groups most similar to Basques are Immigrants from Korea (5.1%, a difference of 0.020%), Immigrants from Hungary (5.1%, a difference of 0.060%), Chilean (5.1%, a difference of 0.090%), Immigrants from Europe (5.1%, a difference of 0.10%), and Ethiopian (5.1%, a difference of 0.10%).
DemographicsRating | RankFemale Unemployment
Immigrants | Croatia
89.9
/100
|
#118
Excellent
5.1%
Immigrants | North Macedonia
88.3
/100
|
#119
Excellent
5.1%
Immigrants | Romania
88.1
/100
|
#120
Excellent
5.1%
Immigrants | Western Europe
88.1
/100
|
#121
Excellent
5.1%
Immigrants | Germany
87.6
/100
|
#122
Excellent
5.1%
Immigrants | South Africa
87.6
/100
|
#123
Excellent
5.1%
Immigrants | Europe
87.2
/100
|
#124
Excellent
5.1%
Basques
86.5
/100
|
#125
Excellent
5.1%
Immigrants | Korea
86.3
/100
|
#126
Excellent
5.1%
Immigrants | Hungary
86.0
/100
|
#127
Excellent
5.1%
Chileans
85.8
/100
|
#128
Excellent
5.1%
Ethiopians
85.7
/100
|
#129
Excellent
5.1%
Maltese
85.5
/100
|
#130
Excellent
5.1%
Immigrants | Ethiopia
85.4
/100
|
#131
Excellent
5.1%
Immigrants | Sri Lanka
85.0
/100
|
#132
Excellent
5.1%

Demographics Similar to Immigrants from Albania by Female Unemployment

In terms of female unemployment, the demographic groups most similar to Immigrants from Albania are Afghan (5.3%, a difference of 0.10%), Costa Rican (5.3%, a difference of 0.10%), Immigrants from Belarus (5.3%, a difference of 0.26%), Ugandan (5.3%, a difference of 0.28%), and Immigrants from Ukraine (5.3%, a difference of 0.30%).
DemographicsRating | RankFemale Unemployment
Immigrants | Congo
43.1
/100
|
#180
Average
5.3%
Taiwanese
42.7
/100
|
#181
Average
5.3%
Immigrants | Nonimmigrants
42.6
/100
|
#182
Average
5.3%
Immigrants | Indonesia
40.7
/100
|
#183
Average
5.3%
Immigrants | Ukraine
40.1
/100
|
#184
Average
5.3%
Malaysians
40.1
/100
|
#185
Average
5.3%
Immigrants | Belarus
39.4
/100
|
#186
Fair
5.3%
Immigrants | Albania
35.4
/100
|
#187
Fair
5.3%
Afghans
33.9
/100
|
#188
Fair
5.3%
Costa Ricans
33.8
/100
|
#189
Fair
5.3%
Ugandans
31.2
/100
|
#190
Fair
5.3%
Cherokee
30.8
/100
|
#191
Fair
5.3%
Portuguese
28.6
/100
|
#192
Fair
5.3%
Arabs
27.7
/100
|
#193
Fair
5.3%
Colombians
27.0
/100
|
#194
Fair
5.3%