Arapaho vs Paraguayan Male Unemployment

COMPARE

Arapaho
Race
Ancestry
AfghanAfricanAlaska NativeAlaskan AthabascanAlbanianAleutAlsatianAmericanApacheArabArapahoArgentineanArmenianAssyrian/Chaldean/SyriacAustralianAustrianBahamianBangladeshiBarbadianBasqueBelgianBelizeanBermudanBhutaneseBlackfeetBolivianBrazilianBritishBritish West IndianBulgarianBurmeseCajunCambodianCanadianCape VerdeanCarpatho RusynCelticCentral AmericanCentral American IndianCherokeeCheyenneChickasawChileanChineseChippewaChoctawColombianColvilleComancheCosta RicanCreeCreekCroatianCrowCubanCypriotCzechCzechoslovakianDanishDelawareDominicanDutchDutch West IndianEastern EuropeanEcuadorianEgyptianEnglishEstonianEthiopianEuropeanFijianFilipinoFinnishFrenchFrench American IndianFrench CanadianGermanGerman RussianGhanaianGreekGuamanian/ChamorroGuatemalanGuyaneseHaitianHmongHonduranHopiHoumaHungarianIcelanderIndian (Asian)IndonesianInupiatIranianIraqiIrishIroquoisIsraeliItalianJamaicanJapaneseJordanianKenyanKiowaKoreanLaotianLatvianLebaneseLiberianLithuanianLumbeeLuxembourgerMacedonianMalaysianMalteseMarshalleseMenomineeMexicanMexican American IndianMongolianMoroccanNative HawaiianNavajoNepaleseNew ZealanderNicaraguanNigerianNorthern EuropeanNorwegianOkinawanOsageOttawaPaiutePakistaniPalestinianPanamanianPennsylvania GermanPeruvianPimaPolishPortuguesePotawatomiPuebloPuerto RicanPuget Sound SalishRomanianRussianSalvadoranSamoanScandinavianScotch-IrishScottishSeminoleSenegaleseSerbianShoshoneSierra LeoneanSiouxSlavicSlovakSloveneSomaliSouth AfricanSouth AmericanSouth American IndianSoviet UnionSpaniardSpanishSpanish AmericanSpanish American IndianSri LankanSubsaharan AfricanSudaneseSwedishSwissSyrianTaiwaneseThaiTlingit-HaidaTohono O'OdhamTonganTrinidadian and TobagonianTsimshianTurkishU.S. Virgin IslanderUgandanUkrainianUruguayanUteVenezuelanVietnameseWelshWest IndianYakamaYaquiYugoslavianYumanYup'ikZimbabwean
Immigration
NonimmigrantsImmigrantsAfghanistanAfricaAlbaniaArgentinaArmeniaAsiaAustraliaAustriaBahamasBangladeshBarbadosBelarusBelgiumBelizeBoliviaBosnia and HerzegovinaBrazilBulgariaBurma/MyanmarCabo VerdeCambodiaCameroonCanadaCaribbeanCentral AmericaChileChinaColombiaCongoCosta RicaCroatiaCubaCzechoslovakiaDenmarkDominicaDominican RepublicEastern AfricaEastern AsiaEastern EuropeEcuadorEgyptEl SalvadorEnglandEritreaEthiopiaEuropeFijiFranceGermanyGhanaGreeceGrenadaGuatemalaGuyanaHaitiHondurasHong KongHungaryIndiaIndonesiaIranIraqIrelandIsraelItalyJamaicaJapanJordanKazakhstanKenyaKoreaKuwaitLaosLatin AmericaLatviaLebanonLiberiaLithuaniaMalaysiaMexicoMicronesiaMiddle AfricaMoldovaMoroccoNepalNetherlandsNicaraguaNigeriaNorth AmericaNorth MacedoniaNorthern AfricaNorthern EuropeNorwayOceaniaPakistanPanamaPeruPhilippinesPolandPortugalRomaniaRussiaSaudi ArabiaScotlandSenegalSerbiaSierra LeoneSingaporeSomaliaSouth AfricaSouth AmericaSouth Central AsiaSouth Eastern AsiaSouthern EuropeSpainSri LankaSt. Vincent and the GrenadinesSudanSwedenSwitzerlandSyriaTaiwanThailandTrinidad and TobagoTurkeyUgandaUkraineUruguayUzbekistanVenezuelaVietnamWest IndiesWestern AfricaWestern AsiaWestern EuropeYemenZaireZimbabweAzores
Paraguayan
Race
Ancestry
AfghanAfricanAlaska NativeAlaskan AthabascanAlbanianAleutAlsatianAmericanApacheArabArgentineanArmenianAssyrian/Chaldean/SyriacAustralianAustrianBahamianBangladeshiBarbadianBasqueBelgianBelizeanBermudanBhutaneseBlackfeetBolivianBrazilianBritishBritish West IndianBulgarianBurmeseCajunCambodianCanadianCape VerdeanCarpatho RusynCelticCentral AmericanCentral American IndianCherokeeCheyenneChickasawChileanChineseChippewaChoctawColombianColvilleComancheCosta RicanCreeCreekCroatianCrowCubanCypriotCzechCzechoslovakianDanishDelawareDominicanDutchDutch West IndianEastern EuropeanEcuadorianEgyptianEnglishEstonianEthiopianEuropeanFijianFilipinoFinnishFrenchFrench American IndianFrench CanadianGermanGerman RussianGhanaianGreekGuamanian/ChamorroGuatemalanGuyaneseHaitianHmongHonduranHopiHoumaHungarianIcelanderIndian (Asian)IndonesianInupiatIranianIraqiIrishIroquoisIsraeliItalianJamaicanJapaneseJordanianKenyanKiowaKoreanLaotianLatvianLebaneseLiberianLithuanianLumbeeLuxembourgerMacedonianMalaysianMalteseMarshalleseMenomineeMexicanMexican American IndianMongolianMoroccanNative HawaiianNavajoNepaleseNew ZealanderNicaraguanNigerianNorthern EuropeanNorwegianOkinawanOsageOttawaPaiutePakistaniPalestinianPanamanianParaguayanPennsylvania GermanPeruvianPimaPolishPortuguesePotawatomiPuebloPuerto RicanPuget Sound SalishRomanianRussianSalvadoranSamoanScandinavianScotch-IrishScottishSeminoleSenegaleseSerbianShoshoneSierra LeoneanSiouxSlavicSlovakSloveneSomaliSouth AfricanSouth AmericanSouth American IndianSoviet UnionSpaniardSpanishSpanish AmericanSpanish American IndianSri LankanSubsaharan AfricanSudaneseSwedishSwissSyrianTaiwaneseThaiTlingit-HaidaTohono O'OdhamTonganTrinidadian and TobagonianTsimshianTurkishU.S. Virgin IslanderUgandanUkrainianUruguayanUteVenezuelanVietnameseWelshWest IndianYakamaYaquiYugoslavianYumanYup'ikZimbabwean
Immigration
NonimmigrantsImmigrantsAfghanistanAfricaAlbaniaArgentinaArmeniaAsiaAustraliaAustriaBahamasBangladeshBarbadosBelarusBelgiumBelizeBoliviaBosnia and HerzegovinaBrazilBulgariaBurma/MyanmarCabo VerdeCambodiaCameroonCanadaCaribbeanCentral AmericaChileChinaColombiaCongoCosta RicaCroatiaCubaCzechoslovakiaDenmarkDominicaDominican RepublicEastern AfricaEastern AsiaEastern EuropeEcuadorEgyptEl SalvadorEnglandEritreaEthiopiaEuropeFijiFranceGermanyGhanaGreeceGrenadaGuatemalaGuyanaHaitiHondurasHong KongHungaryIndiaIndonesiaIranIraqIrelandIsraelItalyJamaicaJapanJordanKazakhstanKenyaKoreaKuwaitLaosLatin AmericaLatviaLebanonLiberiaLithuaniaMalaysiaMexicoMicronesiaMiddle AfricaMoldovaMoroccoNepalNetherlandsNicaraguaNigeriaNorth AmericaNorth MacedoniaNorthern AfricaNorthern EuropeNorwayOceaniaPakistanPanamaPeruPhilippinesPolandPortugalRomaniaRussiaSaudi ArabiaScotlandSenegalSerbiaSierra LeoneSingaporeSomaliaSouth AfricaSouth AmericaSouth Central AsiaSouth Eastern AsiaSouthern EuropeSpainSri LankaSt. Vincent and the GrenadinesSudanSwedenSwitzerlandSyriaTaiwanThailandTrinidad and TobagoTurkeyUgandaUkraineUruguayUzbekistanVenezuelaVietnamWest IndiesWestern AfricaWestern AsiaWestern EuropeYemenZaireZimbabweAzores
Male Unemployment
Income
Poverty
Unemployment
Labor Participation
Family Structure
Vehicle Availability
Education Level
Disability

Male Unemployment Comparison

Arapaho

Paraguayans

Tragic
Exceptional
11.0%
MALE UNEMPLOYMENT
0.0/ 100
METRIC RATING
345th/ 347
METRIC RANK
4.9%
MALE UNEMPLOYMENT
99.5/ 100
METRIC RATING
35th/ 347
METRIC RANK

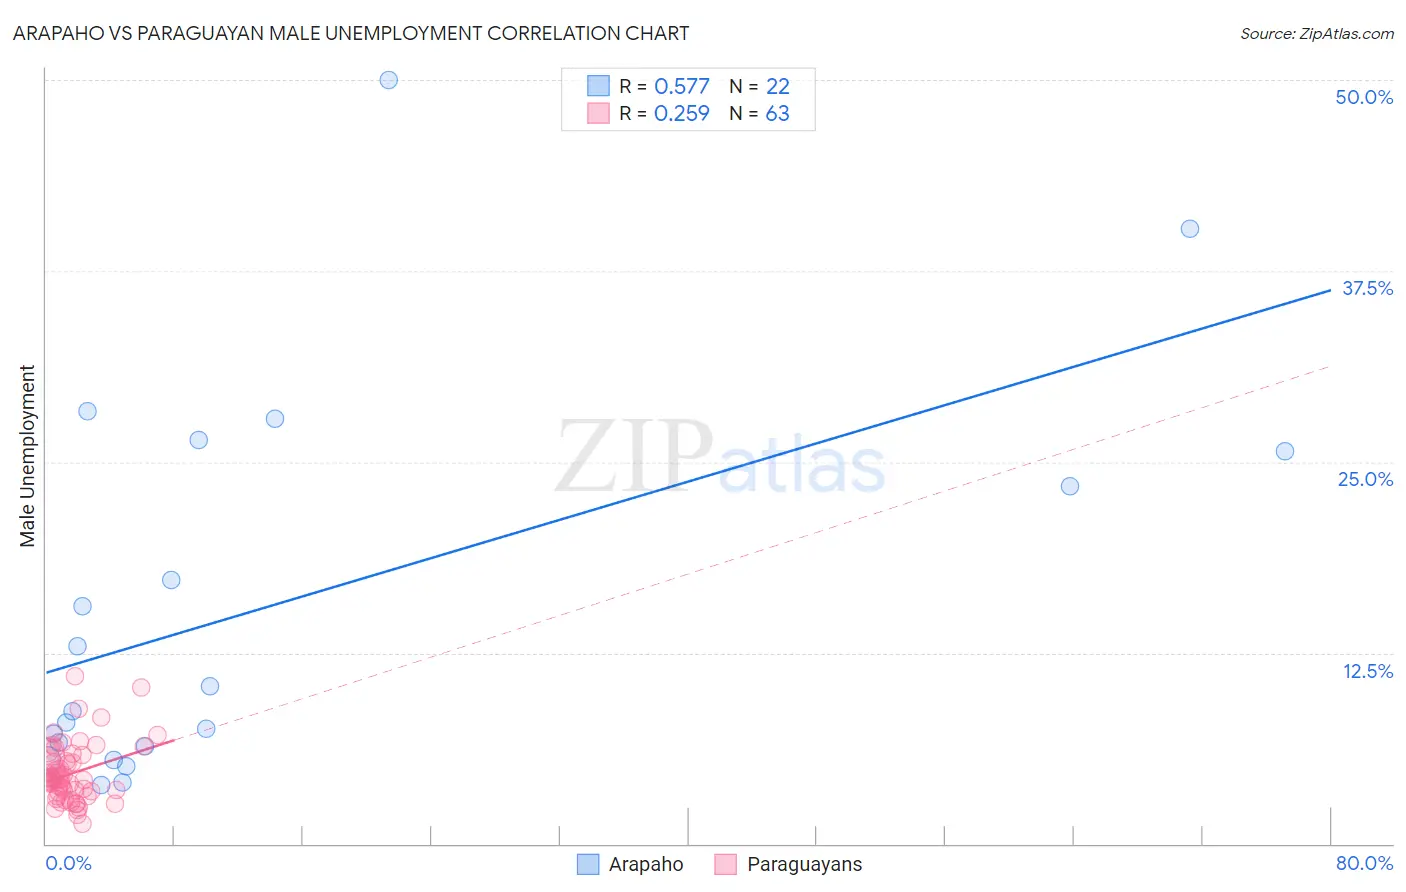
Arapaho vs Paraguayan Male Unemployment Correlation Chart

The statistical analysis conducted on geographies consisting of 29,745,830 people shows a substantial positive correlation between the proportion of Arapaho and unemployment rate among males in the United States with a correlation coefficient (R) of 0.577 and weighted average of 11.0%. Similarly, the statistical analysis conducted on geographies consisting of 95,072,234 people shows a weak positive correlation between the proportion of Paraguayans and unemployment rate among males in the United States with a correlation coefficient (R) of 0.259 and weighted average of 4.9%, a difference of 124.9%.
Arapaho vs Paraguayan Male Unemployment

Male Unemployment Correlation Summary

MeasurementArapahoParaguayan
Minimum3.9%1.3%
Maximum50.0%11.0%
Range46.1%9.7%
Mean15.7%4.6%
Median9.5%4.2%
Interquartile 25% (IQ1)6.4%3.4%
Interquartile 75% (IQ3)25.7%5.7%
Interquartile Range (IQR)19.3%2.3%
Standard Deviation (Sample)12.8%1.9%
Standard Deviation (Population)12.5%1.9%

Similar Demographics by Male Unemployment

Demographics Similar to Arapaho by Male Unemployment

In terms of male unemployment, the demographic groups most similar to Arapaho are Hopi (10.8%, a difference of 2.0%), Crow (10.6%, a difference of 3.7%), Tohono O'odham (10.2%, a difference of 8.2%), Inupiat (12.1%, a difference of 9.8%), and Navajo (9.8%, a difference of 11.9%).
DemographicsRating | RankMale Unemployment
Sioux
0.0
/100
|
#333
Tragic
8.4%
Tsimshian
0.0
/100
|
#334
Tragic
8.5%
Pueblo
0.0
/100
|
#335
Tragic
8.5%
Yuman
0.0
/100
|
#336
Tragic
8.6%
Puerto Ricans
0.0
/100
|
#337
Tragic
8.6%
Apache
0.0
/100
|
#338
Tragic
8.6%
Cheyenne
0.0
/100
|
#339
Tragic
9.8%
Alaskan Athabascans
0.0
/100
|
#340
Tragic
9.8%
Navajo
0.0
/100
|
#341
Tragic
9.8%
Tohono O'odham
0.0
/100
|
#342
Tragic
10.2%
Crow
0.0
/100
|
#343
Tragic
10.6%
Hopi
0.0
/100
|
#344
Tragic
10.8%
Arapaho
0.0
/100
|
#345
Tragic
11.0%
Inupiat
0.0
/100
|
#346
Tragic
12.1%
Yup'ik
0.0
/100
|
#347
Tragic
16.4%

Demographics Similar to Paraguayans by Male Unemployment

In terms of male unemployment, the demographic groups most similar to Paraguayans are Immigrants from Singapore (4.9%, a difference of 0.080%), Scotch-Irish (4.9%, a difference of 0.29%), Immigrants from Bosnia and Herzegovina (4.9%, a difference of 0.31%), Burmese (4.9%, a difference of 0.38%), and Northern European (4.9%, a difference of 0.46%).
DemographicsRating | RankMale Unemployment
Bulgarians
99.8
/100
|
#28
Exceptional
4.8%
Scottish
99.8
/100
|
#29
Exceptional
4.8%
British
99.8
/100
|
#30
Exceptional
4.8%
Sudanese
99.8
/100
|
#31
Exceptional
4.8%
Immigrants | Nepal
99.8
/100
|
#32
Exceptional
4.8%
Latvians
99.7
/100
|
#33
Exceptional
4.8%
Welsh
99.7
/100
|
#34
Exceptional
4.8%
Paraguayans
99.5
/100
|
#35
Exceptional
4.9%
Immigrants | Singapore
99.4
/100
|
#36
Exceptional
4.9%
Scotch-Irish
99.4
/100
|
#37
Exceptional
4.9%
Immigrants | Bosnia and Herzegovina
99.4
/100
|
#38
Exceptional
4.9%
Burmese
99.3
/100
|
#39
Exceptional
4.9%
Northern Europeans
99.3
/100
|
#40
Exceptional
4.9%
Chinese
99.3
/100
|
#41
Exceptional
4.9%
Immigrants | Belgium
99.2
/100
|
#42
Exceptional
4.9%