Zip Codes with the Highest Percentage of Population Employed in Food Preparation & Serving in Warwick, RI
RELATED REPORTS & OPTIONS
Food Preparation & Serving
Warwick
Compare Zip Codes
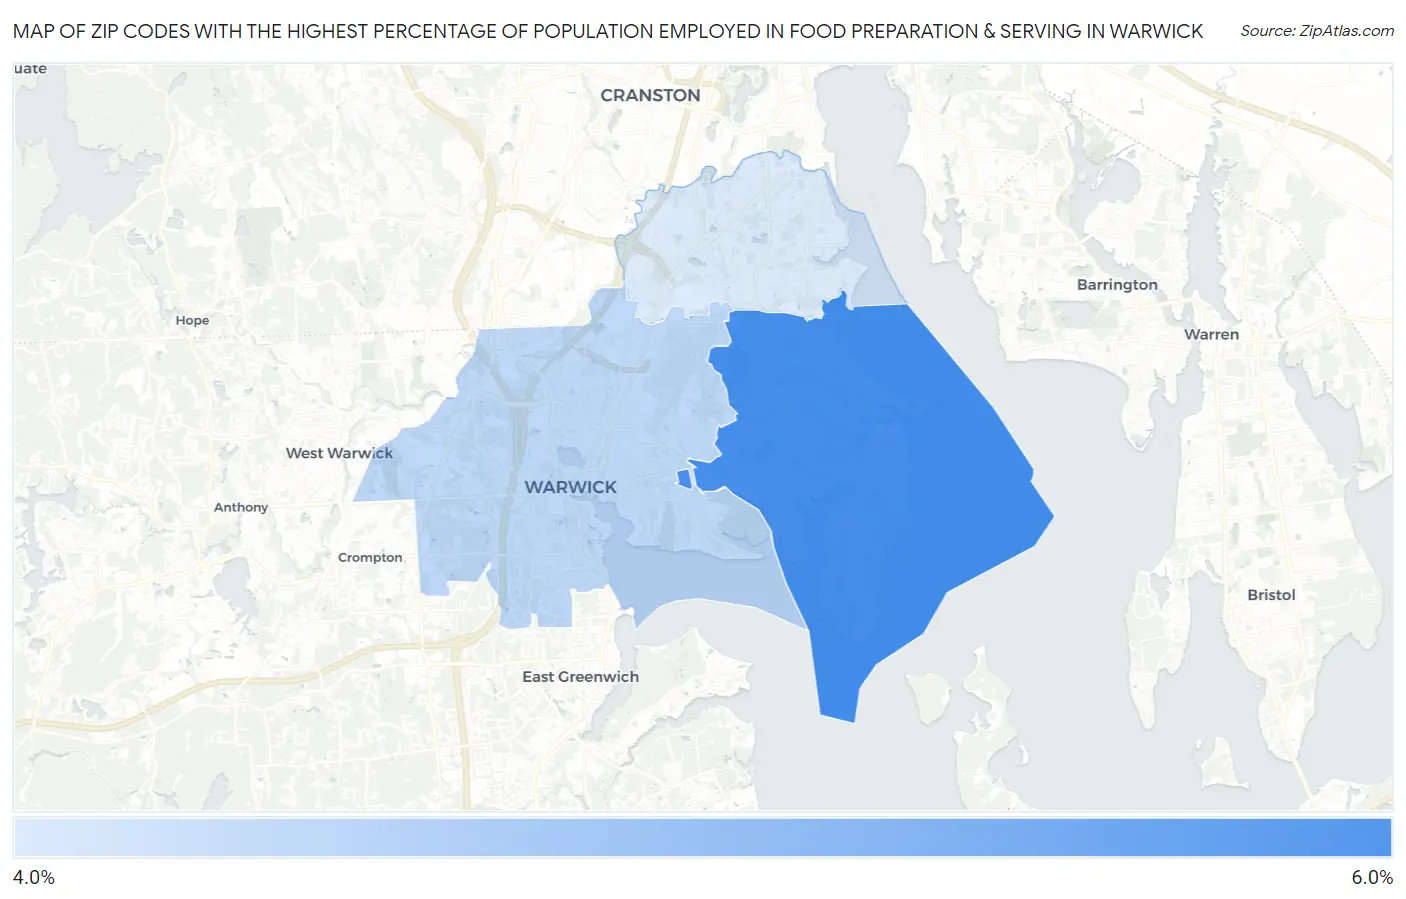
Map of Zip Codes with the Highest Percentage of Population Employed in Food Preparation & Serving in Warwick
0.0%
6.0%
Zip Codes with the Highest Percentage of Population Employed in Food Preparation & Serving in Warwick, RI
| Zip Code | % Employed | vs State | vs National | |
| 1. | 02889 | 5.8% | 5.6%(+0.279)#27 | 5.3%(+0.551)#9,907 |
| 2. | 02886 | 4.7% | 5.6%(-0.876)#50 | 5.3%(-0.603)#14,231 |
| 3. | 02888 | 4.4% | 5.6%(-1.16)#54 | 5.3%(-0.891)#15,444 |
1
Common Questions
What are the Top Zip Codes with the Highest Percentage of Population Employed in Food Preparation & Serving in Warwick, RI?
Top Zip Codes with the Highest Percentage of Population Employed in Food Preparation & Serving in Warwick, RI are:
What zip code has the Highest Percentage of Population Employed in Food Preparation & Serving in Warwick, RI?
02889 has the Highest Percentage of Population Employed in Food Preparation & Serving in Warwick, RI with 5.8%.
What is the Percentage of Population Employed in Food Preparation & Serving in Warwick, RI?
Percentage of Population Employed in Food Preparation & Serving in Warwick is 4.9%.
What is the Percentage of Population Employed in Food Preparation & Serving in Rhode Island?
Percentage of Population Employed in Food Preparation & Serving in Rhode Island is 5.6%.
What is the Percentage of Population Employed in Food Preparation & Serving in the United States?
Percentage of Population Employed in Food Preparation & Serving in the United States is 5.3%.