Zimbabwean vs Czech Male Poverty
COMPARE
Zimbabwean
Czech
Male Poverty
Male Poverty Comparison
Zimbabweans
Czechs
10.2%
MALE POVERTY
97.5/ 100
METRIC RATING
65th/ 347
METRIC RANK
9.8%
MALE POVERTY
99.4/ 100
METRIC RATING
36th/ 347
METRIC RANK
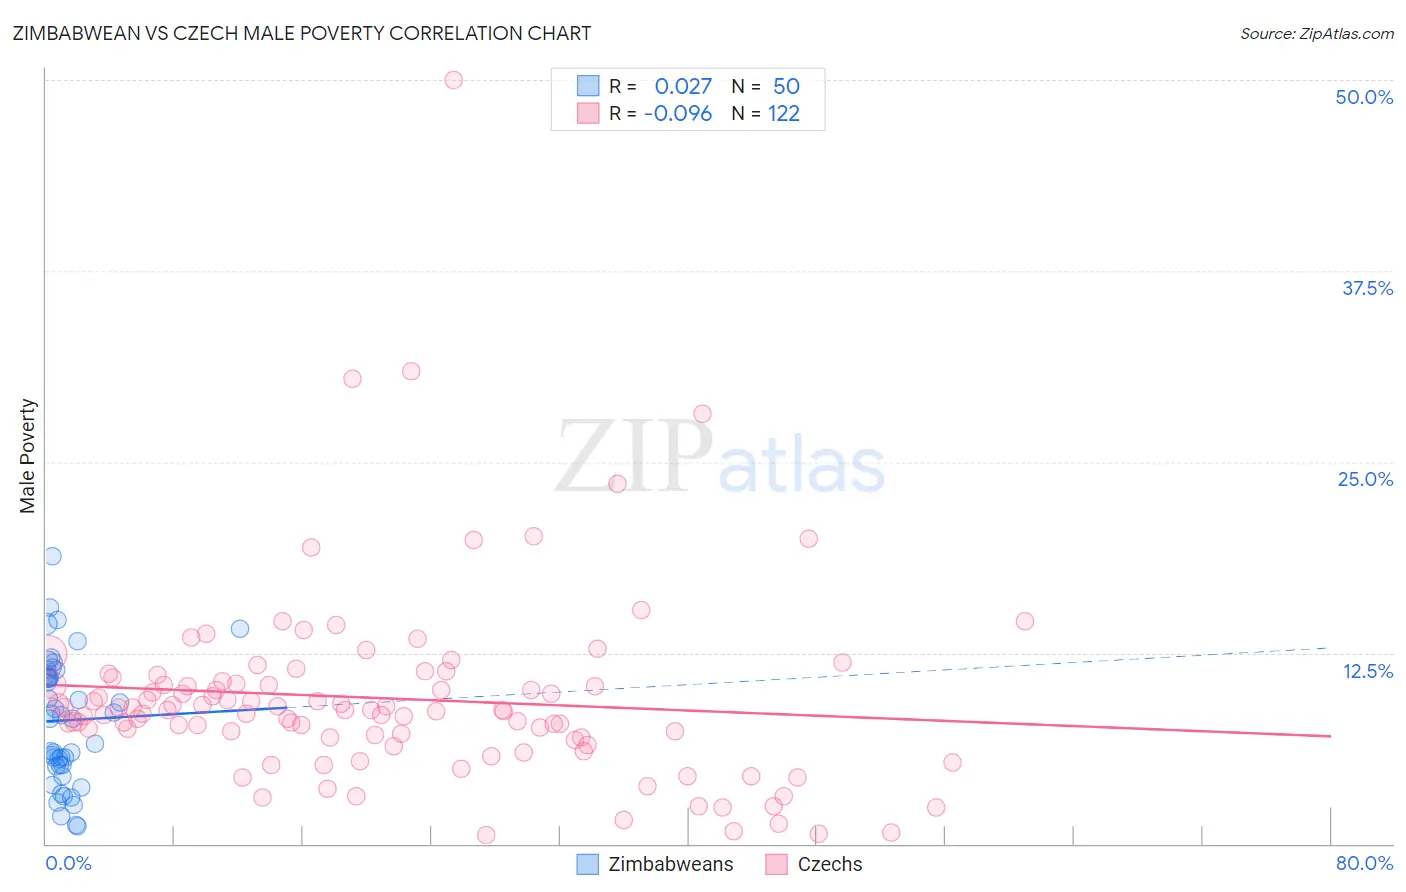
Zimbabwean vs Czech Male Poverty Correlation Chart
The statistical analysis conducted on geographies consisting of 69,180,294 people shows no correlation between the proportion of Zimbabweans and poverty level among males in the United States with a correlation coefficient (R) of 0.027 and weighted average of 10.2%. Similarly, the statistical analysis conducted on geographies consisting of 484,041,978 people shows a slight negative correlation between the proportion of Czechs and poverty level among males in the United States with a correlation coefficient (R) of -0.096 and weighted average of 9.8%, a difference of 4.0%.
Male Poverty Correlation Summary
| Measurement | Zimbabwean | Czech |
| Minimum | 1.2% | 0.55% |
| Maximum | 18.8% | 50.0% |
| Range | 17.7% | 49.5% |
| Mean | 8.1% | 9.5% |
| Median | 8.3% | 8.7% |
| Interquartile 25% (IQ1) | 5.1% | 7.0% |
| Interquartile 75% (IQ3) | 11.1% | 10.4% |
| Interquartile Range (IQR) | 5.9% | 3.5% |
| Standard Deviation (Sample) | 4.1% | 6.4% |
| Standard Deviation (Population) | 4.1% | 6.4% |
Similar Demographics by Male Poverty
Demographics Similar to Zimbabweans by Male Poverty
In terms of male poverty, the demographic groups most similar to Zimbabweans are Serbian (10.2%, a difference of 0.010%), Swiss (10.2%, a difference of 0.070%), Immigrants from Netherlands (10.2%, a difference of 0.18%), Immigrants from Sri Lanka (10.2%, a difference of 0.24%), and Slovak (10.2%, a difference of 0.30%).
| Demographics | Rating | Rank | Male Poverty |
| Scandinavians | 98.0 /100 | #58 | Exceptional 10.1% |
| Immigrants | Europe | 97.9 /100 | #59 | Exceptional 10.1% |
| Ukrainians | 97.9 /100 | #60 | Exceptional 10.1% |
| Austrians | 97.8 /100 | #61 | Exceptional 10.1% |
| Immigrants | Italy | 97.8 /100 | #62 | Exceptional 10.2% |
| Slovaks | 97.7 /100 | #63 | Exceptional 10.2% |
| Swiss | 97.5 /100 | #64 | Exceptional 10.2% |
| Zimbabweans | 97.5 /100 | #65 | Exceptional 10.2% |
| Serbians | 97.5 /100 | #66 | Exceptional 10.2% |
| Immigrants | Netherlands | 97.3 /100 | #67 | Exceptional 10.2% |
| Immigrants | Sri Lanka | 97.2 /100 | #68 | Exceptional 10.2% |
| Immigrants | Australia | 97.1 /100 | #69 | Exceptional 10.2% |
| Paraguayans | 97.1 /100 | #70 | Exceptional 10.2% |
| Europeans | 97.1 /100 | #71 | Exceptional 10.2% |
| Immigrants | Canada | 97.1 /100 | #72 | Exceptional 10.2% |
Demographics Similar to Czechs by Male Poverty
In terms of male poverty, the demographic groups most similar to Czechs are Iranian (9.8%, a difference of 0.090%), Immigrants from Greece (9.8%, a difference of 0.22%), Immigrants from Poland (9.8%, a difference of 0.39%), Immigrants from Northern Europe (9.7%, a difference of 0.54%), and Immigrants from Pakistan (9.9%, a difference of 0.59%).
| Demographics | Rating | Rank | Male Poverty |
| Greeks | 99.6 /100 | #29 | Exceptional 9.7% |
| Poles | 99.5 /100 | #30 | Exceptional 9.7% |
| Tongans | 99.5 /100 | #31 | Exceptional 9.7% |
| Macedonians | 99.5 /100 | #32 | Exceptional 9.7% |
| Immigrants | Northern Europe | 99.5 /100 | #33 | Exceptional 9.7% |
| Immigrants | Poland | 99.5 /100 | #34 | Exceptional 9.8% |
| Iranians | 99.4 /100 | #35 | Exceptional 9.8% |
| Czechs | 99.4 /100 | #36 | Exceptional 9.8% |
| Immigrants | Greece | 99.3 /100 | #37 | Exceptional 9.8% |
| Immigrants | Pakistan | 99.2 /100 | #38 | Exceptional 9.9% |
| Russians | 99.2 /100 | #39 | Exceptional 9.9% |
| Cypriots | 99.2 /100 | #40 | Exceptional 9.9% |
| Koreans | 99.2 /100 | #41 | Exceptional 9.9% |
| Immigrants | Iran | 99.1 /100 | #42 | Exceptional 9.9% |
| Immigrants | Moldova | 99.0 /100 | #43 | Exceptional 9.9% |