Yuman vs Venezuelan Child Poverty Under the Age of 16
COMPARE
Yuman
Venezuelan
Child Poverty Under the Age of 16
Child Poverty Under the Age of 16 Comparison
Yuman
Venezuelans
28.9%
CHILD POVERTY UNDER THE AGE OF 16
0.0/ 100
METRIC RATING
341st/ 347
METRIC RANK
15.6%
CHILD POVERTY UNDER THE AGE OF 16
77.4/ 100
METRIC RATING
153rd/ 347
METRIC RANK
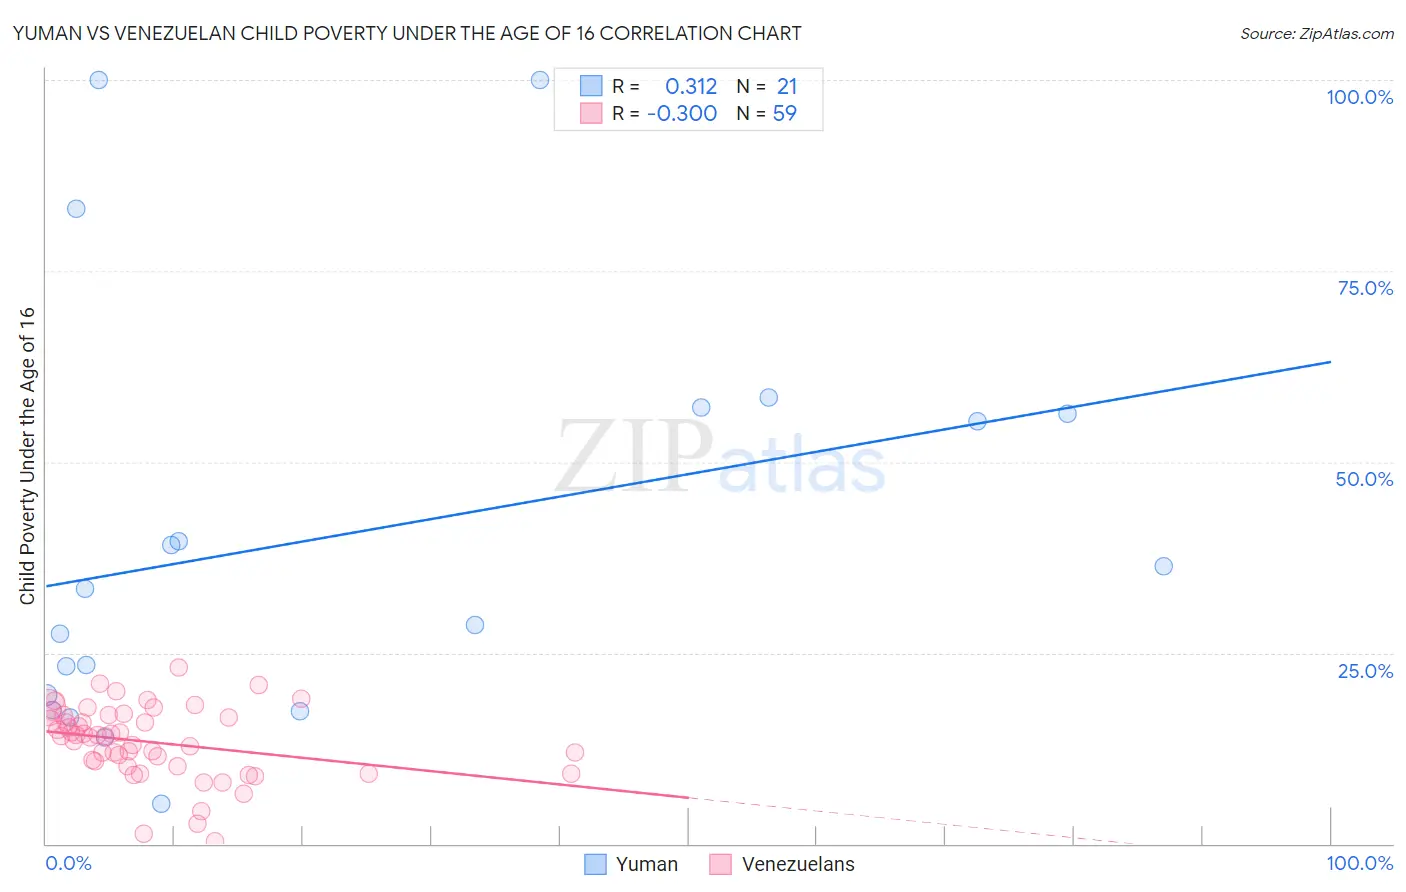
Yuman vs Venezuelan Child Poverty Under the Age of 16 Correlation Chart
The statistical analysis conducted on geographies consisting of 40,623,362 people shows a mild positive correlation between the proportion of Yuman and poverty level among children under the age of 16 in the United States with a correlation coefficient (R) of 0.312 and weighted average of 28.9%. Similarly, the statistical analysis conducted on geographies consisting of 304,499,680 people shows a weak negative correlation between the proportion of Venezuelans and poverty level among children under the age of 16 in the United States with a correlation coefficient (R) of -0.300 and weighted average of 15.6%, a difference of 85.5%.
Child Poverty Under the Age of 16 Correlation Summary
| Measurement | Yuman | Venezuelan |
| Minimum | 5.3% | 0.32% |
| Maximum | 100.0% | 23.1% |
| Range | 94.7% | 22.8% |
| Mean | 40.6% | 13.3% |
| Median | 33.4% | 14.2% |
| Interquartile 25% (IQ1) | 18.5% | 10.1% |
| Interquartile 75% (IQ3) | 56.7% | 16.8% |
| Interquartile Range (IQR) | 38.2% | 6.7% |
| Standard Deviation (Sample) | 27.4% | 4.8% |
| Standard Deviation (Population) | 26.7% | 4.7% |
Similar Demographics by Child Poverty Under the Age of 16
Demographics Similar to Yuman by Child Poverty Under the Age of 16
In terms of child poverty under the age of 16, the demographic groups most similar to Yuman are Pima (29.0%, a difference of 0.26%), Immigrants from Yemen (29.1%, a difference of 0.46%), Navajo (30.2%, a difference of 4.4%), Hopi (27.1%, a difference of 6.8%), and Lumbee (31.0%, a difference of 7.0%).
| Demographics | Rating | Rank | Child Poverty Under the Age of 16 |
| Immigrants | Dominican Republic | 0.0 /100 | #333 | Tragic 24.0% |
| Blacks/African Americans | 0.0 /100 | #334 | Tragic 24.4% |
| Houma | 0.0 /100 | #335 | Tragic 24.9% |
| Yup'ik | 0.0 /100 | #336 | Tragic 25.1% |
| Sioux | 0.0 /100 | #337 | Tragic 25.2% |
| Cheyenne | 0.0 /100 | #338 | Tragic 25.4% |
| Crow | 0.0 /100 | #339 | Tragic 26.0% |
| Hopi | 0.0 /100 | #340 | Tragic 27.1% |
| Yuman | 0.0 /100 | #341 | Tragic 28.9% |
| Pima | 0.0 /100 | #342 | Tragic 29.0% |
| Immigrants | Yemen | 0.0 /100 | #343 | Tragic 29.1% |
| Navajo | 0.0 /100 | #344 | Tragic 30.2% |
| Lumbee | 0.0 /100 | #345 | Tragic 31.0% |
| Tohono O'odham | 0.0 /100 | #346 | Tragic 31.7% |
| Puerto Ricans | 0.0 /100 | #347 | Tragic 32.5% |
Demographics Similar to Venezuelans by Child Poverty Under the Age of 16
In terms of child poverty under the age of 16, the demographic groups most similar to Venezuelans are Samoan (15.6%, a difference of 0.030%), French Canadian (15.6%, a difference of 0.15%), French (15.6%, a difference of 0.18%), Immigrants from Jordan (15.6%, a difference of 0.19%), and Syrian (15.6%, a difference of 0.24%).
| Demographics | Rating | Rank | Child Poverty Under the Age of 16 |
| Slovaks | 81.4 /100 | #146 | Excellent 15.5% |
| Immigrants | Kuwait | 80.5 /100 | #147 | Excellent 15.5% |
| Puget Sound Salish | 80.3 /100 | #148 | Excellent 15.5% |
| Israelis | 80.1 /100 | #149 | Excellent 15.5% |
| Immigrants | Jordan | 78.5 /100 | #150 | Good 15.6% |
| French | 78.5 /100 | #151 | Good 15.6% |
| French Canadians | 78.2 /100 | #152 | Good 15.6% |
| Venezuelans | 77.4 /100 | #153 | Good 15.6% |
| Samoans | 77.3 /100 | #154 | Good 15.6% |
| Syrians | 76.1 /100 | #155 | Good 15.6% |
| Immigrants | Venezuela | 74.9 /100 | #156 | Good 15.7% |
| Immigrants | Nepal | 72.9 /100 | #157 | Good 15.7% |
| Immigrants | Chile | 72.8 /100 | #158 | Good 15.7% |
| Immigrants | Fiji | 71.1 /100 | #159 | Good 15.8% |
| Immigrants | Albania | 70.7 /100 | #160 | Good 15.8% |