Yuman vs Bulgarian Child Poverty Under the Age of 16
COMPARE
Yuman
Bulgarian
Child Poverty Under the Age of 16
Child Poverty Under the Age of 16 Comparison
Yuman
Bulgarians
28.9%
CHILD POVERTY UNDER THE AGE OF 16
0.0/ 100
METRIC RATING
341st/ 347
METRIC RANK
13.0%
CHILD POVERTY UNDER THE AGE OF 16
99.9/ 100
METRIC RATING
17th/ 347
METRIC RANK
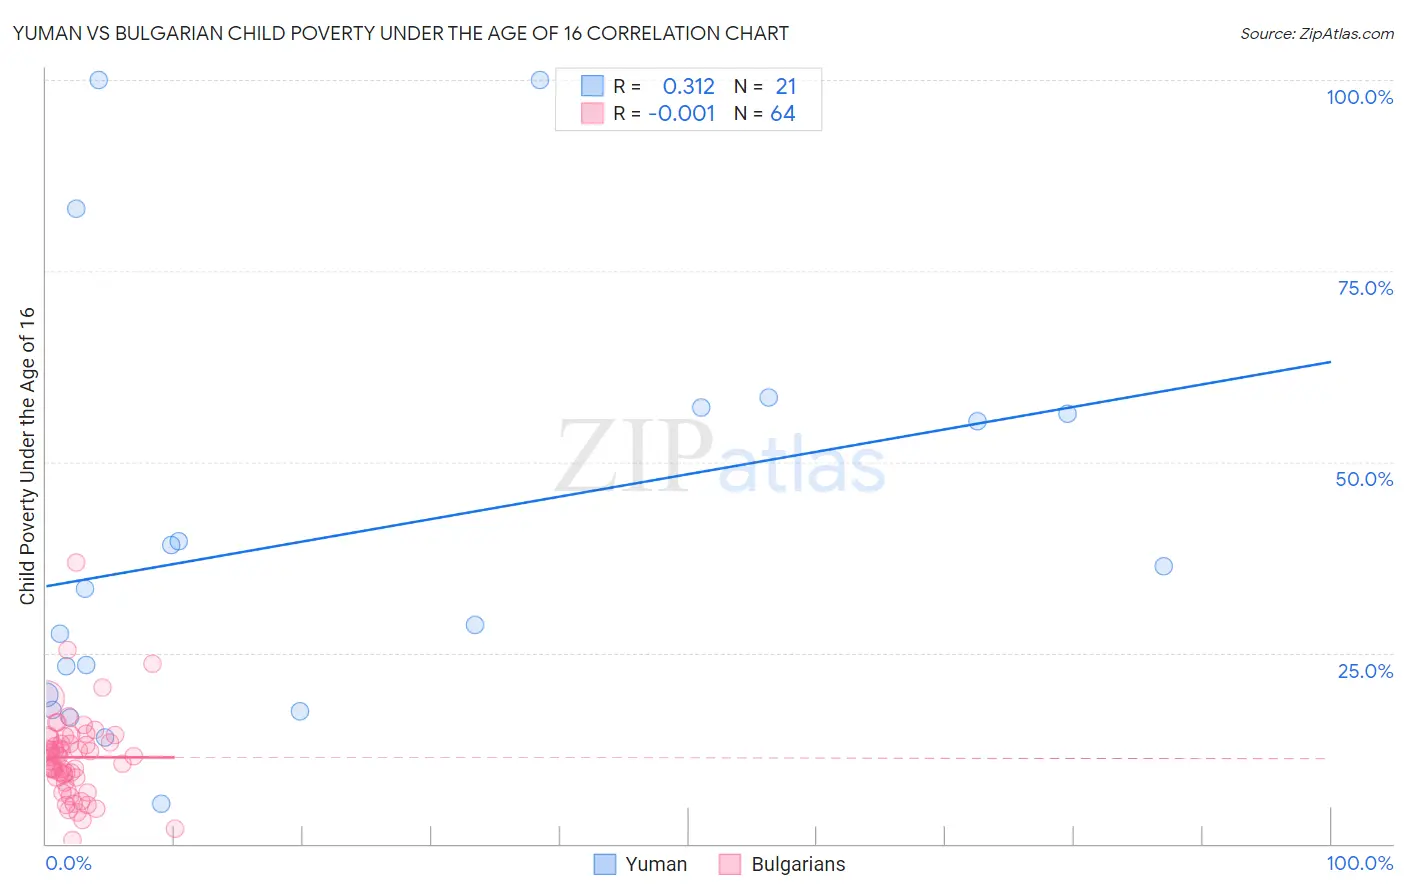
Yuman vs Bulgarian Child Poverty Under the Age of 16 Correlation Chart
The statistical analysis conducted on geographies consisting of 40,623,362 people shows a mild positive correlation between the proportion of Yuman and poverty level among children under the age of 16 in the United States with a correlation coefficient (R) of 0.312 and weighted average of 28.9%. Similarly, the statistical analysis conducted on geographies consisting of 204,354,998 people shows no correlation between the proportion of Bulgarians and poverty level among children under the age of 16 in the United States with a correlation coefficient (R) of -0.001 and weighted average of 13.0%, a difference of 122.9%.
Child Poverty Under the Age of 16 Correlation Summary
| Measurement | Yuman | Bulgarian |
| Minimum | 5.3% | 0.47% |
| Maximum | 100.0% | 36.8% |
| Range | 94.7% | 36.4% |
| Mean | 40.6% | 11.3% |
| Median | 33.4% | 11.4% |
| Interquartile 25% (IQ1) | 18.5% | 8.7% |
| Interquartile 75% (IQ3) | 56.7% | 13.5% |
| Interquartile Range (IQR) | 38.2% | 4.8% |
| Standard Deviation (Sample) | 27.4% | 5.7% |
| Standard Deviation (Population) | 26.7% | 5.6% |
Similar Demographics by Child Poverty Under the Age of 16
Demographics Similar to Yuman by Child Poverty Under the Age of 16
In terms of child poverty under the age of 16, the demographic groups most similar to Yuman are Pima (29.0%, a difference of 0.26%), Immigrants from Yemen (29.1%, a difference of 0.46%), Navajo (30.2%, a difference of 4.4%), Hopi (27.1%, a difference of 6.8%), and Lumbee (31.0%, a difference of 7.0%).
| Demographics | Rating | Rank | Child Poverty Under the Age of 16 |
| Immigrants | Dominican Republic | 0.0 /100 | #333 | Tragic 24.0% |
| Blacks/African Americans | 0.0 /100 | #334 | Tragic 24.4% |
| Houma | 0.0 /100 | #335 | Tragic 24.9% |
| Yup'ik | 0.0 /100 | #336 | Tragic 25.1% |
| Sioux | 0.0 /100 | #337 | Tragic 25.2% |
| Cheyenne | 0.0 /100 | #338 | Tragic 25.4% |
| Crow | 0.0 /100 | #339 | Tragic 26.0% |
| Hopi | 0.0 /100 | #340 | Tragic 27.1% |
| Yuman | 0.0 /100 | #341 | Tragic 28.9% |
| Pima | 0.0 /100 | #342 | Tragic 29.0% |
| Immigrants | Yemen | 0.0 /100 | #343 | Tragic 29.1% |
| Navajo | 0.0 /100 | #344 | Tragic 30.2% |
| Lumbee | 0.0 /100 | #345 | Tragic 31.0% |
| Tohono O'odham | 0.0 /100 | #346 | Tragic 31.7% |
| Puerto Ricans | 0.0 /100 | #347 | Tragic 32.5% |
Demographics Similar to Bulgarians by Child Poverty Under the Age of 16
In terms of child poverty under the age of 16, the demographic groups most similar to Bulgarians are Norwegian (13.0%, a difference of 0.22%), Immigrants from Korea (13.0%, a difference of 0.27%), Cypriot (13.0%, a difference of 0.42%), Immigrants from Japan (13.0%, a difference of 0.45%), and Immigrants from Lithuania (12.9%, a difference of 0.58%).
| Demographics | Rating | Rank | Child Poverty Under the Age of 16 |
| Immigrants | South Central Asia | 99.9 /100 | #10 | Exceptional 12.5% |
| Bhutanese | 99.9 /100 | #11 | Exceptional 12.5% |
| Immigrants | Ireland | 99.9 /100 | #12 | Exceptional 12.7% |
| Burmese | 99.9 /100 | #13 | Exceptional 12.8% |
| Immigrants | Lithuania | 99.9 /100 | #14 | Exceptional 12.9% |
| Immigrants | Korea | 99.9 /100 | #15 | Exceptional 13.0% |
| Norwegians | 99.9 /100 | #16 | Exceptional 13.0% |
| Bulgarians | 99.9 /100 | #17 | Exceptional 13.0% |
| Cypriots | 99.9 /100 | #18 | Exceptional 13.0% |
| Immigrants | Japan | 99.8 /100 | #19 | Exceptional 13.0% |
| Okinawans | 99.8 /100 | #20 | Exceptional 13.1% |
| Immigrants | Eastern Asia | 99.8 /100 | #21 | Exceptional 13.1% |
| Maltese | 99.8 /100 | #22 | Exceptional 13.1% |
| Indians (Asian) | 99.8 /100 | #23 | Exceptional 13.1% |
| Latvians | 99.8 /100 | #24 | Exceptional 13.2% |