Yuman vs Hawaiian Child Poverty Among Girls Under 16

COMPARE

Yuman
Race
Ancestry
AfghanAfricanAlaska NativeAlaskan AthabascanAlbanianAleutAlsatianAmericanApacheArabArapahoArgentineanArmenianAssyrian/Chaldean/SyriacAustralianAustrianBahamianBangladeshiBarbadianBasqueBelgianBelizeanBermudanBhutaneseBlackfeetBolivianBrazilianBritishBritish West IndianBulgarianBurmeseCajunCambodianCanadianCape VerdeanCarpatho RusynCelticCentral AmericanCentral American IndianCherokeeCheyenneChickasawChileanChineseChippewaChoctawColombianColvilleComancheCosta RicanCreeCreekCroatianCrowCubanCypriotCzechCzechoslovakianDanishDelawareDominicanDutchDutch West IndianEastern EuropeanEcuadorianEgyptianEnglishEstonianEthiopianEuropeanFijianFilipinoFinnishFrenchFrench American IndianFrench CanadianGermanGerman RussianGhanaianGreekGuamanian/ChamorroGuatemalanGuyaneseHaitianHmongHonduranHopiHoumaHungarianIcelanderIndian (Asian)IndonesianInupiatIranianIraqiIrishIroquoisIsraeliItalianJamaicanJapaneseJordanianKenyanKiowaKoreanLaotianLatvianLebaneseLiberianLithuanianLumbeeLuxembourgerMacedonianMalaysianMalteseMarshalleseMenomineeMexicanMexican American IndianMongolianMoroccanNative HawaiianNavajoNepaleseNew ZealanderNicaraguanNigerianNorthern EuropeanNorwegianOkinawanOsageOttawaPaiutePakistaniPalestinianPanamanianParaguayanPennsylvania GermanPeruvianPimaPolishPortuguesePotawatomiPuebloPuerto RicanPuget Sound SalishRomanianRussianSalvadoranSamoanScandinavianScotch-IrishScottishSeminoleSenegaleseSerbianShoshoneSierra LeoneanSiouxSlavicSlovakSloveneSomaliSouth AfricanSouth AmericanSouth American IndianSoviet UnionSpaniardSpanishSpanish AmericanSpanish American IndianSri LankanSubsaharan AfricanSudaneseSwedishSwissSyrianTaiwaneseThaiTlingit-HaidaTohono O'OdhamTonganTrinidadian and TobagonianTsimshianTurkishU.S. Virgin IslanderUgandanUkrainianUruguayanUteVenezuelanVietnameseWelshWest IndianYakamaYaquiYugoslavianYumanYup'ikZimbabwean
Immigration
NonimmigrantsImmigrantsAfghanistanAfricaAlbaniaArgentinaArmeniaAsiaAustraliaAustriaBahamasBangladeshBarbadosBelarusBelgiumBelizeBoliviaBosnia and HerzegovinaBrazilBulgariaBurma/MyanmarCabo VerdeCambodiaCameroonCanadaCaribbeanCentral AmericaChileChinaColombiaCongoCosta RicaCroatiaCubaCzechoslovakiaDenmarkDominicaDominican RepublicEastern AfricaEastern AsiaEastern EuropeEcuadorEgyptEl SalvadorEnglandEritreaEthiopiaEuropeFijiFranceGermanyGhanaGreeceGrenadaGuatemalaGuyanaHaitiHondurasHong KongHungaryIndiaIndonesiaIranIraqIrelandIsraelItalyJamaicaJapanJordanKazakhstanKenyaKoreaKuwaitLaosLatin AmericaLatviaLebanonLiberiaLithuaniaMalaysiaMexicoMicronesiaMiddle AfricaMoldovaMoroccoNepalNetherlandsNicaraguaNigeriaNorth AmericaNorth MacedoniaNorthern AfricaNorthern EuropeNorwayOceaniaPakistanPanamaPeruPhilippinesPolandPortugalRomaniaRussiaSaudi ArabiaScotlandSenegalSerbiaSierra LeoneSingaporeSomaliaSouth AfricaSouth AmericaSouth Central AsiaSouth Eastern AsiaSouthern EuropeSpainSri LankaSt. Vincent and the GrenadinesSudanSwedenSwitzerlandSyriaTaiwanThailandTrinidad and TobagoTurkeyUgandaUkraineUruguayUzbekistanVenezuelaVietnamWest IndiesWestern AfricaWestern AsiaWestern EuropeYemenZaireZimbabweAzores
Hawaiian
Race
Ancestry
AfghanAfricanAlaska NativeAlaskan AthabascanAlbanianAleutAlsatianAmericanApacheArabArapahoArgentineanArmenianAssyrian/Chaldean/SyriacAustralianAustrianBahamianBangladeshiBarbadianBasqueBelgianBelizeanBermudanBhutaneseBlackfeetBolivianBrazilianBritishBritish West IndianBulgarianBurmeseCajunCambodianCanadianCape VerdeanCarpatho RusynCelticCentral AmericanCentral American IndianCherokeeCheyenneChickasawChileanChineseChippewaChoctawColombianColvilleComancheCosta RicanCreeCreekCroatianCrowCubanCypriotCzechCzechoslovakianDanishDelawareDominicanDutchDutch West IndianEastern EuropeanEcuadorianEgyptianEnglishEstonianEthiopianEuropeanFijianFilipinoFinnishFrenchFrench American IndianFrench CanadianGermanGerman RussianGhanaianGreekGuamanian/ChamorroGuatemalanGuyaneseHaitianHmongHonduranHopiHoumaHungarianIcelanderIndian (Asian)IndonesianInupiatIranianIraqiIrishIroquoisIsraeliItalianJamaicanJapaneseJordanianKenyanKiowaKoreanLaotianLatvianLebaneseLiberianLithuanianLumbeeLuxembourgerMacedonianMalaysianMalteseMarshalleseMenomineeMexicanMexican American IndianMongolianMoroccanNative HawaiianNavajoNepaleseNew ZealanderNicaraguanNigerianNorthern EuropeanNorwegianOkinawanOsageOttawaPaiutePakistaniPalestinianPanamanianParaguayanPennsylvania GermanPeruvianPimaPolishPortuguesePotawatomiPuebloPuerto RicanPuget Sound SalishRomanianRussianSalvadoranSamoanScandinavianScotch-IrishScottishSeminoleSenegaleseSerbianShoshoneSierra LeoneanSiouxSlavicSlovakSloveneSomaliSouth AfricanSouth AmericanSouth American IndianSoviet UnionSpaniardSpanishSpanish AmericanSpanish American IndianSri LankanSubsaharan AfricanSudaneseSwedishSwissSyrianTaiwaneseThaiTlingit-HaidaTohono O'OdhamTonganTrinidadian and TobagonianTsimshianTurkishU.S. Virgin IslanderUgandanUkrainianUruguayanUteVenezuelanVietnameseWelshWest IndianYakamaYaquiYugoslavianYup'ikZimbabwean
Immigration
NonimmigrantsImmigrantsAfghanistanAfricaAlbaniaArgentinaArmeniaAsiaAustraliaAustriaBahamasBangladeshBarbadosBelarusBelgiumBelizeBoliviaBosnia and HerzegovinaBrazilBulgariaBurma/MyanmarCabo VerdeCambodiaCameroonCanadaCaribbeanCentral AmericaChileChinaColombiaCongoCosta RicaCroatiaCubaCzechoslovakiaDenmarkDominicaDominican RepublicEastern AfricaEastern AsiaEastern EuropeEcuadorEgyptEl SalvadorEnglandEritreaEthiopiaEuropeFijiFranceGermanyGhanaGreeceGrenadaGuatemalaGuyanaHaitiHondurasHong KongHungaryIndiaIndonesiaIranIraqIrelandIsraelItalyJamaicaJapanJordanKazakhstanKenyaKoreaKuwaitLaosLatin AmericaLatviaLebanonLiberiaLithuaniaMalaysiaMexicoMicronesiaMiddle AfricaMoldovaMoroccoNepalNetherlandsNicaraguaNigeriaNorth AmericaNorth MacedoniaNorthern AfricaNorthern EuropeNorwayOceaniaPakistanPanamaPeruPhilippinesPolandPortugalRomaniaRussiaSaudi ArabiaScotlandSenegalSerbiaSierra LeoneSingaporeSomaliaSouth AfricaSouth AmericaSouth Central AsiaSouth Eastern AsiaSouthern EuropeSpainSri LankaSt. Vincent and the GrenadinesSudanSwedenSwitzerlandSyriaTaiwanThailandTrinidad and TobagoTurkeyUgandaUkraineUruguayUzbekistanVenezuelaVietnamWest IndiesWestern AfricaWestern AsiaWestern EuropeYemenZaireZimbabweAzores
Child Poverty Among Girls Under 16
Income
Poverty
Unemployment
Labor Participation
Family Structure
Vehicle Availability
Education Level
Disability

Child Poverty Among Girls Under 16 Comparison

Yuman

Hawaiians

Tragic
Average
27.1%
CHILD POVERTY AMONG GIRLS UNDER 16
0.0/ 100
METRIC RATING
340th/ 347
METRIC RANK
16.6%
CHILD POVERTY AMONG GIRLS UNDER 16
43.4/ 100
METRIC RATING
179th/ 347
METRIC RANK

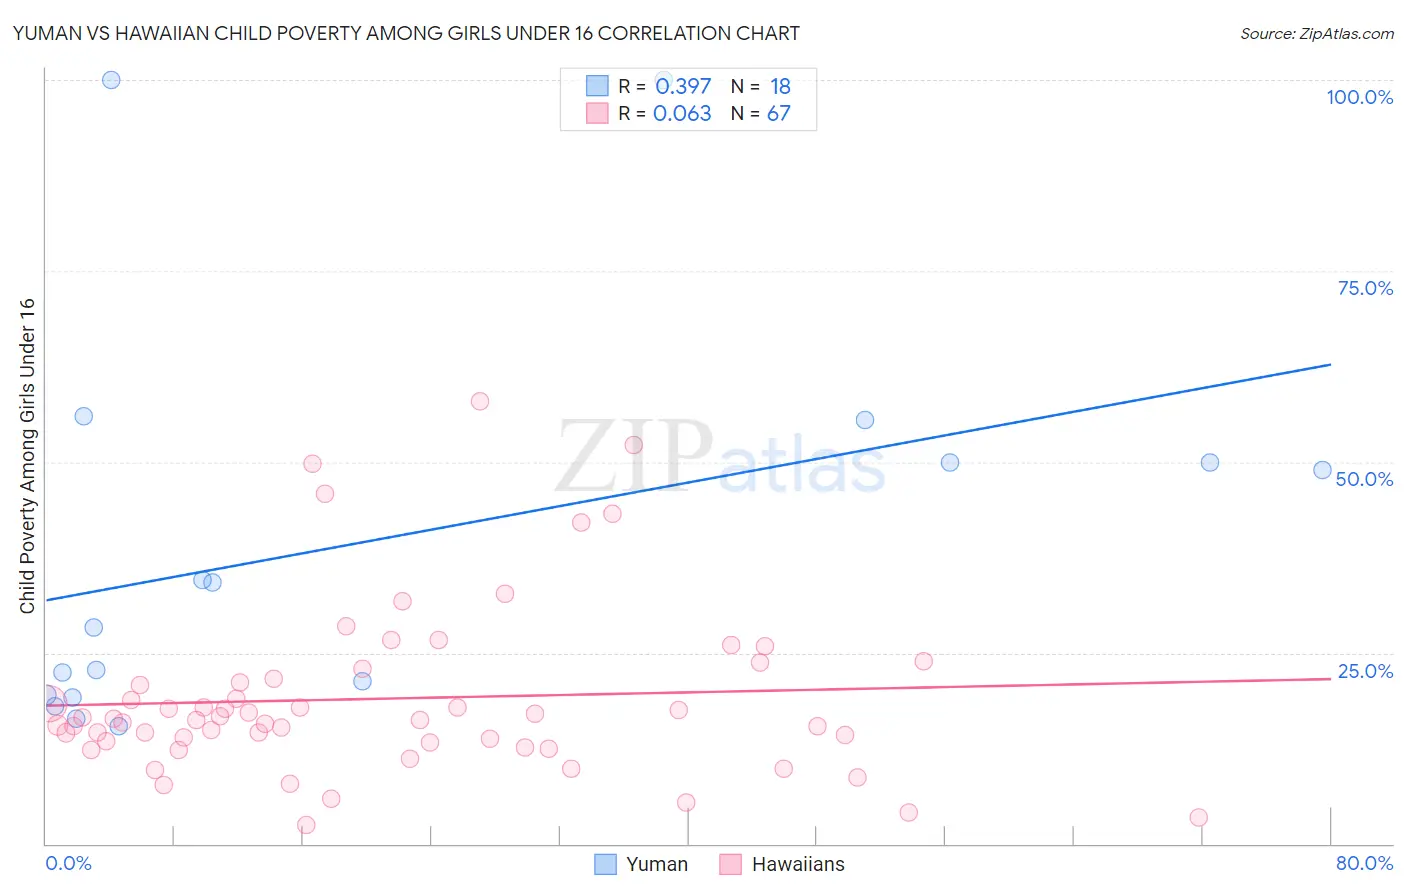
Yuman vs Hawaiian Child Poverty Among Girls Under 16 Correlation Chart

The statistical analysis conducted on geographies consisting of 40,600,954 people shows a mild positive correlation between the proportion of Yuman and poverty level among girls under the age of 16 in the United States with a correlation coefficient (R) of 0.397 and weighted average of 27.1%. Similarly, the statistical analysis conducted on geographies consisting of 324,247,510 people shows a slight positive correlation between the proportion of Hawaiians and poverty level among girls under the age of 16 in the United States with a correlation coefficient (R) of 0.063 and weighted average of 16.6%, a difference of 63.2%.
Yuman vs Hawaiian Child Poverty Among Girls Under 16

Child Poverty Among Girls Under 16 Correlation Summary

MeasurementYumanHawaiian
Minimum15.3%2.5%
Maximum100.0%57.9%
Range84.7%55.4%
Mean39.6%19.0%
Median31.3%16.1%
Interquartile 25% (IQ1)19.5%13.3%
Interquartile 75% (IQ3)50.0%21.7%
Interquartile Range (IQR)30.5%8.4%
Standard Deviation (Sample)26.2%11.3%
Standard Deviation (Population)25.4%11.2%

Similar Demographics by Child Poverty Among Girls Under 16

Demographics Similar to Yuman by Child Poverty Among Girls Under 16

In terms of child poverty among girls under 16, the demographic groups most similar to Yuman are Crow (26.4%, a difference of 2.7%), Hopi (27.9%, a difference of 2.9%), Cheyenne (26.3%, a difference of 3.1%), Pima (28.2%, a difference of 4.2%), and Yup'ik (25.8%, a difference of 4.9%).
DemographicsRating | RankChild Poverty Among Girls Under 16
Blacks/African Americans
0.0
/100
|
#333
Tragic
24.7%
Menominee
0.0
/100
|
#334
Tragic
25.0%
Pueblo
0.0
/100
|
#335
Tragic
25.2%
Sioux
0.0
/100
|
#336
Tragic
25.6%
Yup'ik
0.0
/100
|
#337
Tragic
25.8%
Cheyenne
0.0
/100
|
#338
Tragic
26.3%
Crow
0.0
/100
|
#339
Tragic
26.4%
Yuman
0.0
/100
|
#340
Tragic
27.1%
Hopi
0.0
/100
|
#341
Tragic
27.9%
Pima
0.0
/100
|
#342
Tragic
28.2%
Immigrants | Yemen
0.0
/100
|
#343
Tragic
29.5%
Navajo
0.0
/100
|
#344
Tragic
30.5%
Lumbee
0.0
/100
|
#345
Tragic
30.7%
Tohono O'odham
0.0
/100
|
#346
Tragic
31.6%
Puerto Ricans
0.0
/100
|
#347
Tragic
32.7%

Demographics Similar to Hawaiians by Child Poverty Among Girls Under 16

In terms of child poverty among girls under 16, the demographic groups most similar to Hawaiians are Immigrants from Syria (16.6%, a difference of 0.010%), White/Caucasian (16.6%, a difference of 0.030%), Immigrants from Iraq (16.6%, a difference of 0.030%), Immigrants from Ethiopia (16.6%, a difference of 0.040%), and Immigrants from Western Asia (16.6%, a difference of 0.080%).
DemographicsRating | RankChild Poverty Among Girls Under 16
Afghans
62.3
/100
|
#172
Good
16.2%
Immigrants | South America
55.1
/100
|
#173
Average
16.4%
Ethiopians
50.0
/100
|
#174
Average
16.5%
Lebanese
45.4
/100
|
#175
Average
16.6%
Hungarians
45.1
/100
|
#176
Average
16.6%
Immigrants | Western Asia
44.1
/100
|
#177
Average
16.6%
Whites/Caucasians
43.6
/100
|
#178
Average
16.6%
Hawaiians
43.4
/100
|
#179
Average
16.6%
Immigrants | Syria
43.3
/100
|
#180
Average
16.6%
Immigrants | Iraq
43.2
/100
|
#181
Average
16.6%
Immigrants | Ethiopia
43.1
/100
|
#182
Average
16.6%
Immigrants | Portugal
42.5
/100
|
#183
Average
16.6%
Scotch-Irish
39.6
/100
|
#184
Fair
16.7%
Immigrants | Uruguay
35.6
/100
|
#185
Fair
16.7%
South American Indians
35.0
/100
|
#186
Fair
16.8%