Spaniard vs Hawaiian Child Poverty Among Girls Under 16
COMPARE
Spaniard
Hawaiian
Child Poverty Among Girls Under 16
Child Poverty Among Girls Under 16 Comparison
Spaniards
Hawaiians
17.0%
CHILD POVERTY AMONG GIRLS UNDER 16
24.9/ 100
METRIC RATING
197th/ 347
METRIC RANK
16.6%
CHILD POVERTY AMONG GIRLS UNDER 16
43.4/ 100
METRIC RATING
179th/ 347
METRIC RANK
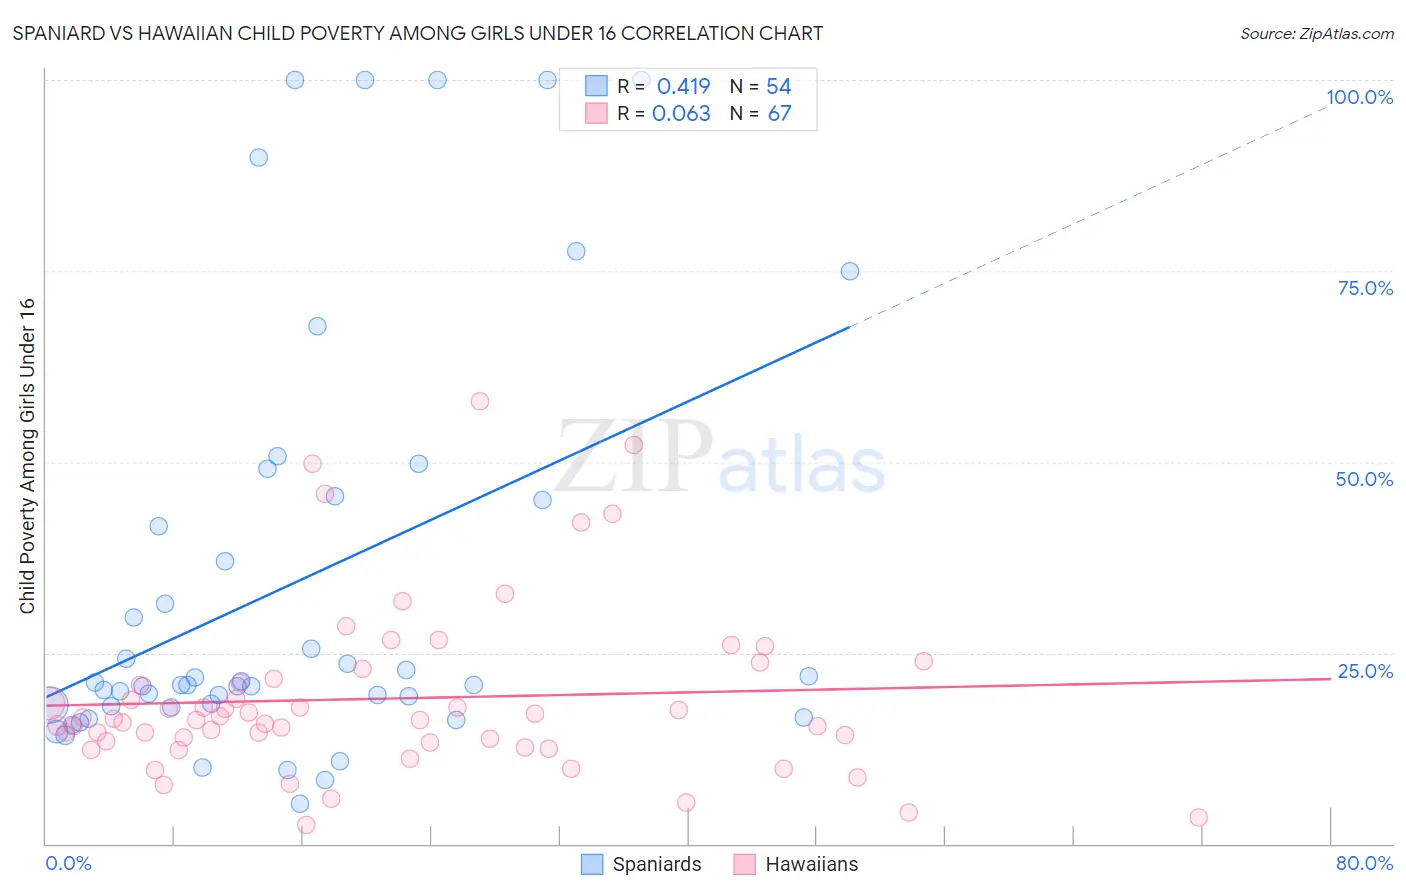
Spaniard vs Hawaiian Child Poverty Among Girls Under 16 Correlation Chart
The statistical analysis conducted on geographies consisting of 434,393,372 people shows a moderate positive correlation between the proportion of Spaniards and poverty level among girls under the age of 16 in the United States with a correlation coefficient (R) of 0.419 and weighted average of 17.0%. Similarly, the statistical analysis conducted on geographies consisting of 324,247,510 people shows a slight positive correlation between the proportion of Hawaiians and poverty level among girls under the age of 16 in the United States with a correlation coefficient (R) of 0.063 and weighted average of 16.6%, a difference of 2.4%.
Child Poverty Among Girls Under 16 Correlation Summary
| Measurement | Spaniard | Hawaiian |
| Minimum | 5.3% | 2.5% |
| Maximum | 100.0% | 57.9% |
| Range | 94.7% | 55.4% |
| Mean | 34.1% | 19.0% |
| Median | 20.8% | 16.1% |
| Interquartile 25% (IQ1) | 18.0% | 13.3% |
| Interquartile 75% (IQ3) | 44.9% | 21.7% |
| Interquartile Range (IQR) | 26.9% | 8.4% |
| Standard Deviation (Sample) | 27.7% | 11.3% |
| Standard Deviation (Population) | 27.4% | 11.2% |
Demographics Similar to Spaniards and Hawaiians by Child Poverty Among Girls Under 16
In terms of child poverty among girls under 16, the demographic groups most similar to Spaniards are Celtic (17.0%, a difference of 0.050%), Immigrants from Costa Rica (17.0%, a difference of 0.11%), Immigrants from Lebanon (17.1%, a difference of 0.35%), Spanish (16.9%, a difference of 0.53%), and Aleut (16.9%, a difference of 0.55%). Similarly, the demographic groups most similar to Hawaiians are Immigrants from Syria (16.6%, a difference of 0.010%), White/Caucasian (16.6%, a difference of 0.030%), Immigrants from Iraq (16.6%, a difference of 0.030%), Immigrants from Ethiopia (16.6%, a difference of 0.040%), and Immigrants from Portugal (16.6%, a difference of 0.11%).
| Demographics | Rating | Rank | Child Poverty Among Girls Under 16 |
| Whites/Caucasians | 43.6 /100 | #178 | Average 16.6% |
| Hawaiians | 43.4 /100 | #179 | Average 16.6% |
| Immigrants | Syria | 43.3 /100 | #180 | Average 16.6% |
| Immigrants | Iraq | 43.2 /100 | #181 | Average 16.6% |
| Immigrants | Ethiopia | 43.1 /100 | #182 | Average 16.6% |
| Immigrants | Portugal | 42.5 /100 | #183 | Average 16.6% |
| Scotch-Irish | 39.6 /100 | #184 | Fair 16.7% |
| Immigrants | Uruguay | 35.6 /100 | #185 | Fair 16.7% |
| South American Indians | 35.0 /100 | #186 | Fair 16.8% |
| Immigrants | Morocco | 34.6 /100 | #187 | Fair 16.8% |
| Arabs | 34.5 /100 | #188 | Fair 16.8% |
| Immigrants | Bosnia and Herzegovina | 32.5 /100 | #189 | Fair 16.8% |
| Kenyans | 32.3 /100 | #190 | Fair 16.8% |
| Immigrants | Azores | 31.3 /100 | #191 | Fair 16.8% |
| Immigrants | Uganda | 31.3 /100 | #192 | Fair 16.8% |
| Aleuts | 28.7 /100 | #193 | Fair 16.9% |
| Spanish | 28.6 /100 | #194 | Fair 16.9% |
| Immigrants | Costa Rica | 25.6 /100 | #195 | Fair 17.0% |
| Celtics | 25.2 /100 | #196 | Fair 17.0% |
| Spaniards | 24.9 /100 | #197 | Fair 17.0% |
| Immigrants | Lebanon | 22.6 /100 | #198 | Fair 17.1% |