Yugoslavian vs Immigrants from Ukraine Single Mother Poverty

COMPARE

Yugoslavian
Race
Ancestry
AfghanAfricanAlaska NativeAlaskan AthabascanAlbanianAleutAlsatianAmericanApacheArabArapahoArgentineanArmenianAssyrian/Chaldean/SyriacAustralianAustrianBahamianBangladeshiBarbadianBasqueBelgianBelizeanBermudanBhutaneseBlackfeetBolivianBrazilianBritishBritish West IndianBulgarianBurmeseCajunCambodianCanadianCape VerdeanCarpatho RusynCelticCentral AmericanCentral American IndianCherokeeCheyenneChickasawChileanChineseChippewaChoctawColombianColvilleComancheCosta RicanCreeCreekCroatianCrowCubanCypriotCzechCzechoslovakianDanishDelawareDominicanDutchDutch West IndianEastern EuropeanEcuadorianEgyptianEnglishEstonianEthiopianEuropeanFijianFilipinoFinnishFrenchFrench American IndianFrench CanadianGermanGerman RussianGhanaianGreekGuamanian/ChamorroGuatemalanGuyaneseHaitianHmongHonduranHopiHoumaHungarianIcelanderIndian (Asian)IndonesianInupiatIranianIraqiIrishIroquoisIsraeliItalianJamaicanJapaneseJordanianKenyanKiowaKoreanLaotianLatvianLebaneseLiberianLithuanianLumbeeLuxembourgerMacedonianMalaysianMalteseMarshalleseMenomineeMexicanMexican American IndianMongolianMoroccanNative HawaiianNavajoNepaleseNew ZealanderNicaraguanNigerianNorthern EuropeanNorwegianOkinawanOsageOttawaPaiutePakistaniPalestinianPanamanianParaguayanPennsylvania GermanPeruvianPimaPolishPortuguesePotawatomiPuebloPuerto RicanPuget Sound SalishRomanianRussianSalvadoranSamoanScandinavianScotch-IrishScottishSeminoleSenegaleseSerbianShoshoneSierra LeoneanSiouxSlavicSlovakSloveneSomaliSouth AfricanSouth AmericanSouth American IndianSoviet UnionSpaniardSpanishSpanish AmericanSpanish American IndianSri LankanSubsaharan AfricanSudaneseSwedishSwissSyrianTaiwaneseThaiTlingit-HaidaTohono O'OdhamTonganTrinidadian and TobagonianTsimshianTurkishU.S. Virgin IslanderUgandanUkrainianUruguayanUteVenezuelanVietnameseWelshWest IndianYakamaYaquiYugoslavianYumanYup'ikZimbabwean
Immigration
NonimmigrantsImmigrantsAfghanistanAfricaAlbaniaArgentinaArmeniaAsiaAustraliaAustriaBahamasBangladeshBarbadosBelarusBelgiumBelizeBoliviaBosnia and HerzegovinaBrazilBulgariaBurma/MyanmarCabo VerdeCambodiaCameroonCanadaCaribbeanCentral AmericaChileChinaColombiaCongoCosta RicaCroatiaCubaCzechoslovakiaDenmarkDominicaDominican RepublicEastern AfricaEastern AsiaEastern EuropeEcuadorEgyptEl SalvadorEnglandEritreaEthiopiaEuropeFijiFranceGermanyGhanaGreeceGrenadaGuatemalaGuyanaHaitiHondurasHong KongHungaryIndiaIndonesiaIranIraqIrelandIsraelItalyJamaicaJapanJordanKazakhstanKenyaKoreaKuwaitLaosLatin AmericaLatviaLebanonLiberiaLithuaniaMalaysiaMexicoMicronesiaMiddle AfricaMoldovaMoroccoNepalNetherlandsNicaraguaNigeriaNorth AmericaNorth MacedoniaNorthern AfricaNorthern EuropeNorwayOceaniaPakistanPanamaPeruPhilippinesPolandPortugalRomaniaRussiaSaudi ArabiaScotlandSenegalSerbiaSierra LeoneSingaporeSomaliaSouth AfricaSouth AmericaSouth Central AsiaSouth Eastern AsiaSouthern EuropeSpainSri LankaSt. Vincent and the GrenadinesSudanSwedenSwitzerlandSyriaTaiwanThailandTrinidad and TobagoTurkeyUgandaUruguayUzbekistanVenezuelaVietnamWest IndiesWestern AfricaWestern AsiaWestern EuropeYemenZaireZimbabweAzores
Immigrants from Ukraine
Race
Ancestry
AfghanAfricanAlaska NativeAlaskan AthabascanAlbanianAleutAlsatianAmericanApacheArabArapahoArgentineanArmenianAssyrian/Chaldean/SyriacAustralianAustrianBahamianBangladeshiBarbadianBasqueBelgianBelizeanBermudanBhutaneseBlackfeetBolivianBrazilianBritishBritish West IndianBulgarianBurmeseCajunCambodianCanadianCape VerdeanCarpatho RusynCelticCentral AmericanCentral American IndianCherokeeCheyenneChickasawChileanChineseChippewaChoctawColombianColvilleComancheCosta RicanCreeCreekCroatianCrowCubanCypriotCzechCzechoslovakianDanishDelawareDominicanDutchDutch West IndianEastern EuropeanEcuadorianEgyptianEnglishEstonianEthiopianEuropeanFijianFilipinoFinnishFrenchFrench American IndianFrench CanadianGermanGerman RussianGhanaianGreekGuamanian/ChamorroGuatemalanGuyaneseHaitianHmongHonduranHopiHoumaHungarianIcelanderIndian (Asian)IndonesianInupiatIranianIraqiIrishIroquoisIsraeliItalianJamaicanJapaneseJordanianKenyanKiowaKoreanLaotianLatvianLebaneseLiberianLithuanianLumbeeLuxembourgerMacedonianMalaysianMalteseMarshalleseMenomineeMexicanMexican American IndianMongolianMoroccanNative HawaiianNavajoNepaleseNew ZealanderNicaraguanNigerianNorthern EuropeanNorwegianOkinawanOsageOttawaPaiutePakistaniPalestinianPanamanianParaguayanPennsylvania GermanPeruvianPimaPolishPortuguesePotawatomiPuebloPuerto RicanPuget Sound SalishRomanianRussianSalvadoranSamoanScandinavianScotch-IrishScottishSeminoleSenegaleseSerbianShoshoneSierra LeoneanSiouxSlavicSlovakSloveneSomaliSouth AfricanSouth AmericanSouth American IndianSoviet UnionSpaniardSpanishSpanish AmericanSpanish American IndianSri LankanSubsaharan AfricanSudaneseSwedishSwissSyrianTaiwaneseThaiTlingit-HaidaTohono O'OdhamTonganTrinidadian and TobagonianTsimshianTurkishU.S. Virgin IslanderUgandanUkrainianUruguayanUteVenezuelanVietnameseWelshWest IndianYakamaYaquiYumanYup'ikZimbabwean
Immigration
NonimmigrantsImmigrantsAfghanistanAfricaAlbaniaArgentinaArmeniaAsiaAustraliaAustriaBahamasBangladeshBarbadosBelarusBelgiumBelizeBoliviaBosnia and HerzegovinaBrazilBulgariaBurma/MyanmarCabo VerdeCambodiaCameroonCanadaCaribbeanCentral AmericaChileChinaColombiaCongoCosta RicaCroatiaCubaCzechoslovakiaDenmarkDominicaDominican RepublicEastern AfricaEastern AsiaEastern EuropeEcuadorEgyptEl SalvadorEnglandEritreaEthiopiaEuropeFijiFranceGermanyGhanaGreeceGrenadaGuatemalaGuyanaHaitiHondurasHong KongHungaryIndiaIndonesiaIranIraqIrelandIsraelItalyJamaicaJapanJordanKazakhstanKenyaKoreaKuwaitLaosLatin AmericaLatviaLebanonLiberiaLithuaniaMalaysiaMexicoMicronesiaMiddle AfricaMoldovaMoroccoNepalNetherlandsNicaraguaNigeriaNorth AmericaNorth MacedoniaNorthern AfricaNorthern EuropeNorwayOceaniaPakistanPanamaPeruPhilippinesPolandPortugalRomaniaRussiaSaudi ArabiaScotlandSenegalSerbiaSierra LeoneSingaporeSomaliaSouth AfricaSouth AmericaSouth Central AsiaSouth Eastern AsiaSouthern EuropeSpainSri LankaSt. Vincent and the GrenadinesSudanSwedenSwitzerlandSyriaTaiwanThailandTrinidad and TobagoTurkeyUgandaUkraineUruguayUzbekistanVenezuelaVietnamWest IndiesWestern AfricaWestern AsiaWestern EuropeYemenZaireZimbabweAzores
Single Mother Poverty
Income
Poverty
Unemployment
Labor Participation
Family Structure
Vehicle Availability
Education Level
Disability

Single Mother Poverty Comparison

Yugoslavians

Immigrants from Ukraine

Fair
Exceptional
29.4%
SINGLE MOTHER POVERTY
36.0/ 100
METRIC RATING
186th/ 347
METRIC RANK
27.7%
SINGLE MOTHER POVERTY
98.6/ 100
METRIC RATING
86th/ 347
METRIC RANK

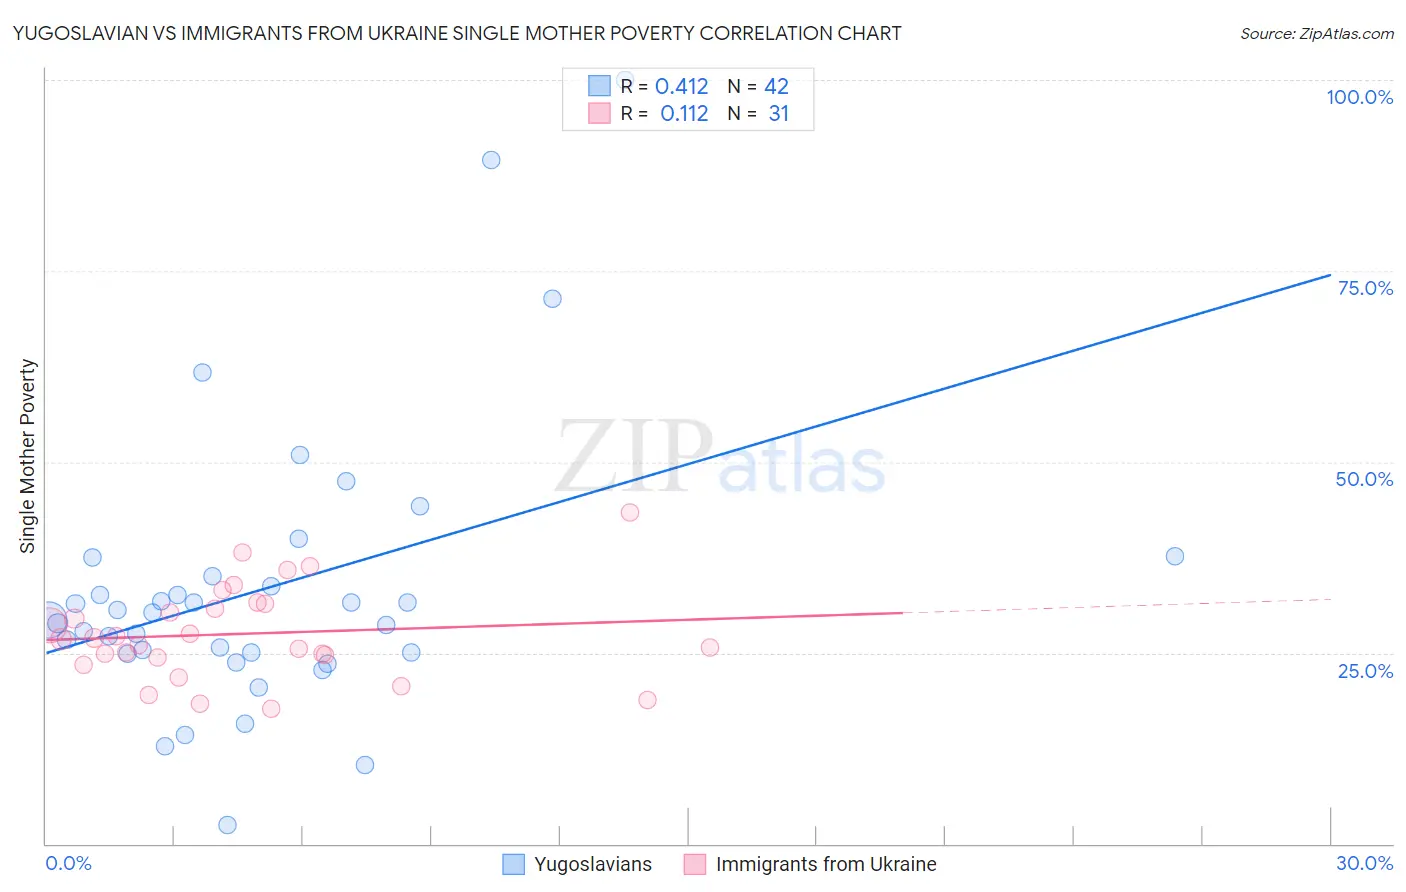
Yugoslavian vs Immigrants from Ukraine Single Mother Poverty Correlation Chart

The statistical analysis conducted on geographies consisting of 280,794,338 people shows a moderate positive correlation between the proportion of Yugoslavians and poverty level among single mothers in the United States with a correlation coefficient (R) of 0.412 and weighted average of 29.4%. Similarly, the statistical analysis conducted on geographies consisting of 283,283,290 people shows a poor positive correlation between the proportion of Immigrants from Ukraine and poverty level among single mothers in the United States with a correlation coefficient (R) of 0.112 and weighted average of 27.7%, a difference of 6.1%.
Yugoslavian vs Immigrants from Ukraine Single Mother Poverty

Single Mother Poverty Correlation Summary

MeasurementYugoslavianImmigrants from Ukraine
Minimum2.5%17.6%
Maximum100.0%43.4%
Range97.5%25.8%
Mean33.4%27.5%
Median29.7%26.8%
Interquartile 25% (IQ1)25.0%24.4%
Interquartile 75% (IQ3)35.0%31.5%
Interquartile Range (IQR)10.0%7.1%
Standard Deviation (Sample)18.6%6.1%
Standard Deviation (Population)18.4%6.0%

Similar Demographics by Single Mother Poverty

Demographics Similar to Yugoslavians by Single Mother Poverty

In terms of single mother poverty, the demographic groups most similar to Yugoslavians are Ghanaian (29.4%, a difference of 0.040%), Nigerian (29.3%, a difference of 0.10%), Nepalese (29.3%, a difference of 0.11%), Immigrants from Eastern Africa (29.3%, a difference of 0.13%), and Lebanese (29.4%, a difference of 0.19%).
DemographicsRating | RankSingle Mother Poverty
Immigrants | Uzbekistan
42.6
/100
|
#179
Average
29.3%
Immigrants | Norway
41.5
/100
|
#180
Average
29.3%
Canadians
40.4
/100
|
#181
Average
29.3%
Immigrants | Eastern Africa
38.5
/100
|
#182
Fair
29.3%
Nepalese
38.3
/100
|
#183
Fair
29.3%
Nigerians
38.0
/100
|
#184
Fair
29.3%
Ghanaians
36.8
/100
|
#185
Fair
29.4%
Yugoslavians
36.0
/100
|
#186
Fair
29.4%
Lebanese
32.5
/100
|
#187
Fair
29.4%
Guamanians/Chamorros
31.8
/100
|
#188
Fair
29.4%
Immigrants | Africa
31.6
/100
|
#189
Fair
29.4%
Immigrants | Germany
30.4
/100
|
#190
Fair
29.5%
Immigrants | Trinidad and Tobago
29.2
/100
|
#191
Fair
29.5%
Moroccans
28.6
/100
|
#192
Fair
29.5%
Basques
28.3
/100
|
#193
Fair
29.5%

Demographics Similar to Immigrants from Ukraine by Single Mother Poverty

In terms of single mother poverty, the demographic groups most similar to Immigrants from Ukraine are Mongolian (27.7%, a difference of 0.090%), Immigrants from Latvia (27.7%, a difference of 0.10%), Afghan (27.7%, a difference of 0.10%), Ethiopian (27.7%, a difference of 0.12%), and Greek (27.7%, a difference of 0.13%).
DemographicsRating | RankSingle Mother Poverty
Immigrants | Italy
99.1
/100
|
#79
Exceptional
27.5%
Taiwanese
99.1
/100
|
#80
Exceptional
27.5%
Immigrants | Scotland
98.9
/100
|
#81
Exceptional
27.6%
Immigrants | Cameroon
98.8
/100
|
#82
Exceptional
27.6%
Greeks
98.7
/100
|
#83
Exceptional
27.7%
Immigrants | Latvia
98.7
/100
|
#84
Exceptional
27.7%
Mongolians
98.7
/100
|
#85
Exceptional
27.7%
Immigrants | Ukraine
98.6
/100
|
#86
Exceptional
27.7%
Afghans
98.5
/100
|
#87
Exceptional
27.7%
Ethiopians
98.4
/100
|
#88
Exceptional
27.7%
Immigrants | Ethiopia
98.4
/100
|
#89
Exceptional
27.7%
Immigrants | France
98.2
/100
|
#90
Exceptional
27.8%
Immigrants | Albania
98.0
/100
|
#91
Exceptional
27.8%
Estonians
97.9
/100
|
#92
Exceptional
27.8%
Romanians
97.8
/100
|
#93
Exceptional
27.8%