Yaqui vs Pakistani Male Poverty
COMPARE
Yaqui
Pakistani
Male Poverty
Male Poverty Comparison
Yaqui
Pakistanis
13.7%
MALE POVERTY
0.0/ 100
METRIC RATING
281st/ 347
METRIC RANK
10.8%
MALE POVERTY
83.0/ 100
METRIC RATING
133rd/ 347
METRIC RANK
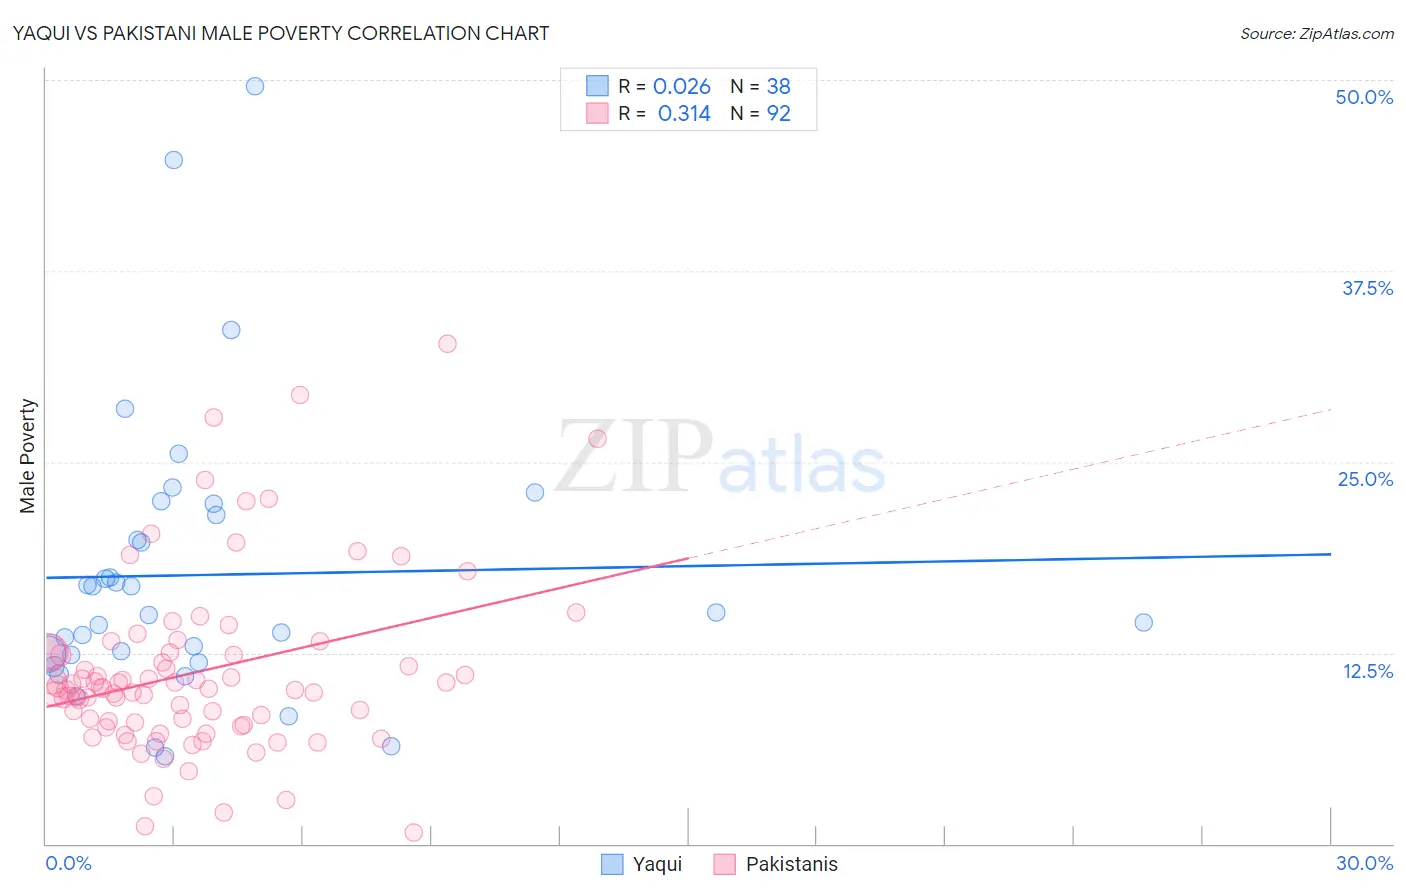
Yaqui vs Pakistani Male Poverty Correlation Chart
The statistical analysis conducted on geographies consisting of 107,706,572 people shows no correlation between the proportion of Yaqui and poverty level among males in the United States with a correlation coefficient (R) of 0.026 and weighted average of 13.7%. Similarly, the statistical analysis conducted on geographies consisting of 335,136,890 people shows a mild positive correlation between the proportion of Pakistanis and poverty level among males in the United States with a correlation coefficient (R) of 0.314 and weighted average of 10.8%, a difference of 27.3%.
Male Poverty Correlation Summary
| Measurement | Yaqui | Pakistani |
| Minimum | 5.7% | 0.75% |
| Maximum | 49.6% | 32.7% |
| Range | 43.9% | 32.0% |
| Mean | 17.6% | 11.2% |
| Median | 15.0% | 10.2% |
| Interquartile 25% (IQ1) | 12.4% | 7.9% |
| Interquartile 75% (IQ3) | 21.5% | 12.5% |
| Interquartile Range (IQR) | 9.1% | 4.6% |
| Standard Deviation (Sample) | 9.3% | 5.8% |
| Standard Deviation (Population) | 9.2% | 5.8% |
Similar Demographics by Male Poverty
Demographics Similar to Yaqui by Male Poverty
In terms of male poverty, the demographic groups most similar to Yaqui are Mexican (13.7%, a difference of 0.050%), Haitian (13.7%, a difference of 0.14%), Immigrants from Cabo Verde (13.7%, a difference of 0.27%), Belizean (13.6%, a difference of 0.32%), and Bangladeshi (13.6%, a difference of 0.41%).
| Demographics | Rating | Rank | Male Poverty |
| Immigrants | West Indies | 0.0 /100 | #274 | Tragic 13.5% |
| Barbadians | 0.0 /100 | #275 | Tragic 13.6% |
| Immigrants | Latin America | 0.0 /100 | #276 | Tragic 13.6% |
| Bangladeshis | 0.0 /100 | #277 | Tragic 13.6% |
| Belizeans | 0.0 /100 | #278 | Tragic 13.6% |
| Haitians | 0.0 /100 | #279 | Tragic 13.7% |
| Mexicans | 0.0 /100 | #280 | Tragic 13.7% |
| Yaqui | 0.0 /100 | #281 | Tragic 13.7% |
| Immigrants | Cabo Verde | 0.0 /100 | #282 | Tragic 13.7% |
| Comanche | 0.0 /100 | #283 | Tragic 13.8% |
| Immigrants | Haiti | 0.0 /100 | #284 | Tragic 13.8% |
| West Indians | 0.0 /100 | #285 | Tragic 13.8% |
| Shoshone | 0.0 /100 | #286 | Tragic 13.8% |
| Immigrants | Barbados | 0.0 /100 | #287 | Tragic 13.8% |
| Immigrants | St. Vincent and the Grenadines | 0.0 /100 | #288 | Tragic 13.8% |
Demographics Similar to Pakistanis by Male Poverty
In terms of male poverty, the demographic groups most similar to Pakistanis are Immigrants from Vietnam (10.8%, a difference of 0.010%), New Zealander (10.8%, a difference of 0.010%), Brazilian (10.8%, a difference of 0.050%), Immigrants from Belarus (10.7%, a difference of 0.060%), and Chilean (10.7%, a difference of 0.17%).
| Demographics | Rating | Rank | Male Poverty |
| Immigrants | Ukraine | 84.3 /100 | #126 | Excellent 10.7% |
| Puget Sound Salish | 84.3 /100 | #127 | Excellent 10.7% |
| Immigrants | Western Europe | 84.2 /100 | #128 | Excellent 10.7% |
| Immigrants | Peru | 84.1 /100 | #129 | Excellent 10.7% |
| Chileans | 83.9 /100 | #130 | Excellent 10.7% |
| Immigrants | Belarus | 83.3 /100 | #131 | Excellent 10.7% |
| Immigrants | Vietnam | 83.0 /100 | #132 | Excellent 10.8% |
| Pakistanis | 83.0 /100 | #133 | Excellent 10.8% |
| New Zealanders | 82.9 /100 | #134 | Excellent 10.8% |
| Brazilians | 82.7 /100 | #135 | Excellent 10.8% |
| Immigrants | Israel | 80.9 /100 | #136 | Excellent 10.8% |
| Immigrants | Switzerland | 79.2 /100 | #137 | Good 10.8% |
| Yugoslavians | 78.2 /100 | #138 | Good 10.8% |
| Immigrants | Jordan | 77.5 /100 | #139 | Good 10.8% |
| Tlingit-Haida | 76.1 /100 | #140 | Good 10.9% |