Ugandan vs Ute Single Father Poverty
COMPARE
Ugandan
Ute
Single Father Poverty
Single Father Poverty Comparison
Ugandans
Ute
16.3%
SINGLE FATHER POVERTY
55.9/ 100
METRIC RATING
162nd/ 347
METRIC RANK
18.5%
SINGLE FATHER POVERTY
0.0/ 100
METRIC RATING
304th/ 347
METRIC RANK
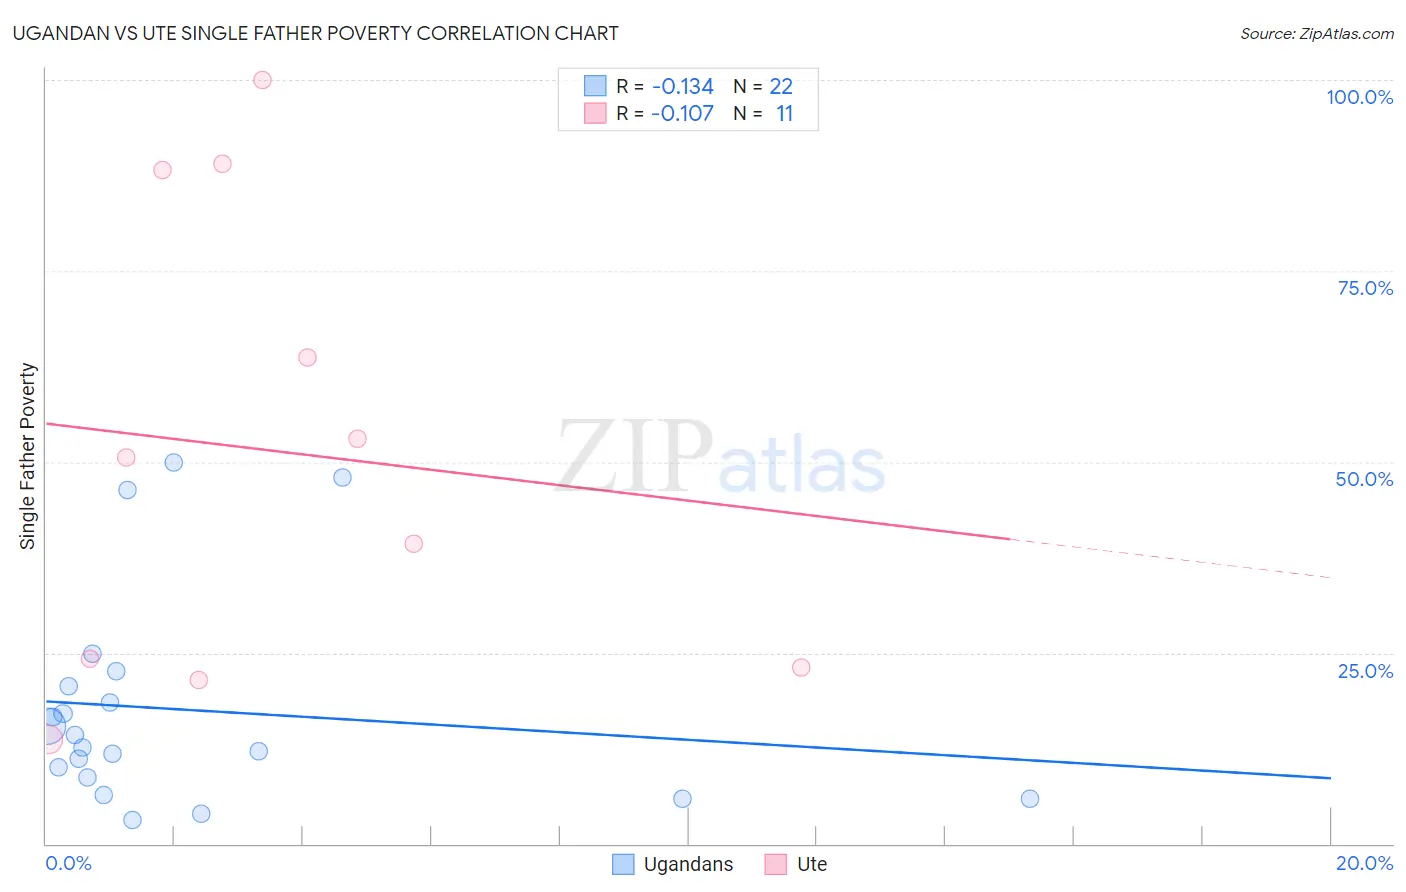
Ugandan vs Ute Single Father Poverty Correlation Chart
The statistical analysis conducted on geographies consisting of 87,224,974 people shows a poor negative correlation between the proportion of Ugandans and poverty level among single fathers in the United States with a correlation coefficient (R) of -0.134 and weighted average of 16.3%. Similarly, the statistical analysis conducted on geographies consisting of 52,132,597 people shows a poor negative correlation between the proportion of Ute and poverty level among single fathers in the United States with a correlation coefficient (R) of -0.107 and weighted average of 18.5%, a difference of 13.9%.
Single Father Poverty Correlation Summary
| Measurement | Ugandan | Ute |
| Minimum | 3.2% | 13.7% |
| Maximum | 50.0% | 100.0% |
| Range | 46.8% | 86.3% |
| Mean | 17.5% | 51.5% |
| Median | 13.4% | 50.6% |
| Interquartile 25% (IQ1) | 8.7% | 23.1% |
| Interquartile 75% (IQ3) | 20.6% | 88.2% |
| Interquartile Range (IQR) | 11.9% | 65.1% |
| Standard Deviation (Sample) | 13.7% | 30.5% |
| Standard Deviation (Population) | 13.4% | 29.1% |
Similar Demographics by Single Father Poverty
Demographics Similar to Ugandans by Single Father Poverty
In terms of single father poverty, the demographic groups most similar to Ugandans are Immigrants from Costa Rica (16.3%, a difference of 0.010%), Guyanese (16.3%, a difference of 0.030%), Estonian (16.2%, a difference of 0.040%), Immigrants from Bangladesh (16.3%, a difference of 0.040%), and Immigrants from Europe (16.3%, a difference of 0.050%).
| Demographics | Rating | Rank | Single Father Poverty |
| Immigrants | Nicaragua | 67.8 /100 | #155 | Good 16.2% |
| Immigrants | Jordan | 66.0 /100 | #156 | Good 16.2% |
| Immigrants | Czechoslovakia | 62.8 /100 | #157 | Good 16.2% |
| Portuguese | 62.3 /100 | #158 | Good 16.2% |
| Belizeans | 59.9 /100 | #159 | Average 16.2% |
| Immigrants | Sudan | 59.8 /100 | #160 | Average 16.2% |
| Estonians | 56.7 /100 | #161 | Average 16.2% |
| Ugandans | 55.9 /100 | #162 | Average 16.3% |
| Immigrants | Costa Rica | 55.7 /100 | #163 | Average 16.3% |
| Guyanese | 55.2 /100 | #164 | Average 16.3% |
| Immigrants | Bangladesh | 55.1 /100 | #165 | Average 16.3% |
| Immigrants | Europe | 54.8 /100 | #166 | Average 16.3% |
| Yugoslavians | 53.9 /100 | #167 | Average 16.3% |
| Costa Ricans | 53.6 /100 | #168 | Average 16.3% |
| Northern Europeans | 52.8 /100 | #169 | Average 16.3% |
Demographics Similar to Ute by Single Father Poverty
In terms of single father poverty, the demographic groups most similar to Ute are Blackfeet (18.5%, a difference of 0.050%), Celtic (18.5%, a difference of 0.14%), Comanche (18.5%, a difference of 0.18%), Scotch-Irish (18.6%, a difference of 0.27%), and Hungarian (18.5%, a difference of 0.29%).
| Demographics | Rating | Rank | Single Father Poverty |
| French | 0.0 /100 | #297 | Tragic 18.2% |
| Africans | 0.0 /100 | #298 | Tragic 18.3% |
| Whites/Caucasians | 0.0 /100 | #299 | Tragic 18.4% |
| Immigrants | Dominican Republic | 0.0 /100 | #300 | Tragic 18.4% |
| Hungarians | 0.0 /100 | #301 | Tragic 18.5% |
| Comanche | 0.0 /100 | #302 | Tragic 18.5% |
| Celtics | 0.0 /100 | #303 | Tragic 18.5% |
| Ute | 0.0 /100 | #304 | Tragic 18.5% |
| Blackfeet | 0.0 /100 | #305 | Tragic 18.5% |
| Scotch-Irish | 0.0 /100 | #306 | Tragic 18.6% |
| French Canadians | 0.0 /100 | #307 | Tragic 18.6% |
| Ottawa | 0.0 /100 | #308 | Tragic 18.6% |
| Immigrants | Micronesia | 0.0 /100 | #309 | Tragic 18.6% |
| Chippewa | 0.0 /100 | #310 | Tragic 18.8% |
| Immigrants | Nonimmigrants | 0.0 /100 | #311 | Tragic 18.8% |