Tongan vs Burmese Family Poverty

COMPARE

Tongan
Race
Ancestry
AfghanAfricanAlaska NativeAlaskan AthabascanAlbanianAleutAlsatianAmericanApacheArabArapahoArgentineanArmenianAssyrian/Chaldean/SyriacAustralianAustrianBahamianBangladeshiBarbadianBasqueBelgianBelizeanBermudanBhutaneseBlackfeetBolivianBrazilianBritishBritish West IndianBulgarianCajunCambodianCanadianCape VerdeanCarpatho RusynCelticCentral AmericanCentral American IndianCherokeeCheyenneChickasawChileanChineseChippewaChoctawColombianColvilleComancheCosta RicanCreeCreekCroatianCrowCubanCypriotCzechCzechoslovakianDanishDelawareDominicanDutchDutch West IndianEastern EuropeanEcuadorianEgyptianEnglishEstonianEthiopianEuropeanFijianFilipinoFinnishFrenchFrench American IndianFrench CanadianGermanGerman RussianGhanaianGreekGuamanian/ChamorroGuatemalanGuyaneseHaitianHmongHonduranHopiHoumaHungarianIcelanderIndian (Asian)IndonesianInupiatIranianIraqiIrishIroquoisIsraeliItalianJamaicanJapaneseJordanianKenyanKiowaKoreanLaotianLatvianLebaneseLiberianLithuanianLumbeeLuxembourgerMacedonianMalaysianMalteseMarshalleseMenomineeMexicanMexican American IndianMongolianMoroccanNative HawaiianNavajoNepaleseNew ZealanderNicaraguanNigerianNorthern EuropeanNorwegianOkinawanOsageOttawaPaiutePakistaniPalestinianPanamanianParaguayanPennsylvania GermanPeruvianPimaPolishPortuguesePotawatomiPuebloPuerto RicanPuget Sound SalishRomanianRussianSalvadoranSamoanScandinavianScotch-IrishScottishSeminoleSenegaleseSerbianShoshoneSierra LeoneanSiouxSlavicSlovakSloveneSomaliSouth AfricanSouth AmericanSouth American IndianSoviet UnionSpaniardSpanishSpanish AmericanSpanish American IndianSri LankanSubsaharan AfricanSudaneseSwedishSwissSyrianTaiwaneseThaiTlingit-HaidaTohono O'OdhamTonganTrinidadian and TobagonianTsimshianTurkishU.S. Virgin IslanderUgandanUkrainianUruguayanUteVenezuelanVietnameseWelshWest IndianYakamaYaquiYugoslavianYumanYup'ikZimbabwean
Immigration
NonimmigrantsImmigrantsAfghanistanAfricaAlbaniaArgentinaArmeniaAsiaAustraliaAustriaBahamasBangladeshBarbadosBelarusBelgiumBelizeBoliviaBosnia and HerzegovinaBrazilBulgariaBurma/MyanmarCabo VerdeCambodiaCameroonCanadaCaribbeanCentral AmericaChileChinaColombiaCongoCosta RicaCroatiaCubaCzechoslovakiaDenmarkDominicaDominican RepublicEastern AfricaEastern AsiaEastern EuropeEcuadorEgyptEl SalvadorEnglandEritreaEthiopiaEuropeFijiFranceGermanyGhanaGreeceGrenadaGuatemalaGuyanaHaitiHondurasHong KongHungaryIndiaIndonesiaIranIraqIrelandIsraelItalyJamaicaJapanJordanKazakhstanKenyaKoreaKuwaitLaosLatin AmericaLatviaLebanonLiberiaLithuaniaMalaysiaMexicoMicronesiaMiddle AfricaMoldovaMoroccoNepalNetherlandsNicaraguaNigeriaNorth AmericaNorth MacedoniaNorthern AfricaNorthern EuropeNorwayOceaniaPakistanPanamaPeruPhilippinesPolandPortugalRomaniaRussiaSaudi ArabiaScotlandSenegalSerbiaSierra LeoneSingaporeSomaliaSouth AfricaSouth AmericaSouth Central AsiaSouth Eastern AsiaSouthern EuropeSpainSri LankaSt. Vincent and the GrenadinesSudanSwedenSwitzerlandSyriaTaiwanThailandTrinidad and TobagoTurkeyUgandaUkraineUruguayUzbekistanVenezuelaVietnamWest IndiesWestern AfricaWestern AsiaWestern EuropeYemenZaireZimbabweAzores
Burmese
Race
Ancestry
AfghanAfricanAlaska NativeAlaskan AthabascanAlbanianAleutAlsatianAmericanApacheArabArapahoArgentineanArmenianAssyrian/Chaldean/SyriacAustralianAustrianBahamianBangladeshiBarbadianBasqueBelgianBelizeanBermudanBhutaneseBlackfeetBolivianBrazilianBritishBritish West IndianBulgarianBurmeseCajunCambodianCanadianCape VerdeanCarpatho RusynCelticCentral AmericanCentral American IndianCherokeeCheyenneChickasawChileanChineseChippewaChoctawColombianColvilleComancheCosta RicanCreeCreekCroatianCrowCubanCypriotCzechCzechoslovakianDanishDelawareDominicanDutchDutch West IndianEastern EuropeanEcuadorianEgyptianEnglishEstonianEthiopianEuropeanFijianFilipinoFinnishFrenchFrench American IndianFrench CanadianGermanGerman RussianGhanaianGreekGuamanian/ChamorroGuatemalanGuyaneseHaitianHmongHonduranHopiHoumaHungarianIcelanderIndian (Asian)IndonesianInupiatIranianIraqiIrishIroquoisIsraeliItalianJamaicanJapaneseJordanianKenyanKiowaKoreanLaotianLatvianLebaneseLiberianLithuanianLumbeeLuxembourgerMacedonianMalaysianMalteseMarshalleseMenomineeMexicanMexican American IndianMongolianMoroccanNative HawaiianNavajoNepaleseNew ZealanderNicaraguanNigerianNorthern EuropeanNorwegianOkinawanOsageOttawaPaiutePakistaniPalestinianPanamanianParaguayanPennsylvania GermanPeruvianPimaPolishPortuguesePotawatomiPuebloPuerto RicanPuget Sound SalishRomanianRussianSalvadoranSamoanScandinavianScotch-IrishScottishSeminoleSenegaleseSerbianShoshoneSierra LeoneanSiouxSlavicSlovakSloveneSomaliSouth AfricanSouth AmericanSouth American IndianSoviet UnionSpaniardSpanishSpanish AmericanSpanish American IndianSri LankanSubsaharan AfricanSudaneseSwedishSwissSyrianTaiwaneseThaiTlingit-HaidaTohono O'OdhamTrinidadian and TobagonianTsimshianTurkishU.S. Virgin IslanderUgandanUkrainianUruguayanUteVenezuelanVietnameseWelshWest IndianYakamaYaquiYugoslavianYumanYup'ikZimbabwean
Immigration
NonimmigrantsImmigrantsAfghanistanAfricaAlbaniaArgentinaArmeniaAsiaAustraliaAustriaBahamasBangladeshBarbadosBelarusBelgiumBelizeBoliviaBosnia and HerzegovinaBrazilBulgariaBurma/MyanmarCabo VerdeCambodiaCameroonCanadaCaribbeanCentral AmericaChileChinaColombiaCongoCosta RicaCroatiaCubaCzechoslovakiaDenmarkDominicaDominican RepublicEastern AfricaEastern AsiaEastern EuropeEcuadorEgyptEl SalvadorEnglandEritreaEthiopiaEuropeFijiFranceGermanyGhanaGreeceGrenadaGuatemalaGuyanaHaitiHondurasHong KongHungaryIndiaIndonesiaIranIraqIrelandIsraelItalyJamaicaJapanJordanKazakhstanKenyaKoreaKuwaitLaosLatin AmericaLatviaLebanonLiberiaLithuaniaMalaysiaMexicoMicronesiaMiddle AfricaMoldovaMoroccoNepalNetherlandsNicaraguaNigeriaNorth AmericaNorth MacedoniaNorthern AfricaNorthern EuropeNorwayOceaniaPakistanPanamaPeruPhilippinesPolandPortugalRomaniaRussiaSaudi ArabiaScotlandSenegalSerbiaSierra LeoneSingaporeSomaliaSouth AfricaSouth AmericaSouth Central AsiaSouth Eastern AsiaSouthern EuropeSpainSri LankaSt. Vincent and the GrenadinesSudanSwedenSwitzerlandSyriaTaiwanThailandTrinidad and TobagoTurkeyUgandaUkraineUruguayUzbekistanVenezuelaVietnamWest IndiesWestern AfricaWestern AsiaWestern EuropeYemenZaireZimbabweAzores
Family Poverty
Income
Poverty
Unemployment
Labor Participation
Family Structure
Vehicle Availability
Education Level
Disability

Family Poverty Comparison

Tongans

Burmese

Exceptional
Exceptional
7.7%
FAMILY POVERTY
98.9/ 100
METRIC RATING
46th/ 347
METRIC RANK
7.3%
FAMILY POVERTY
99.7/ 100
METRIC RATING
25th/ 347
METRIC RANK

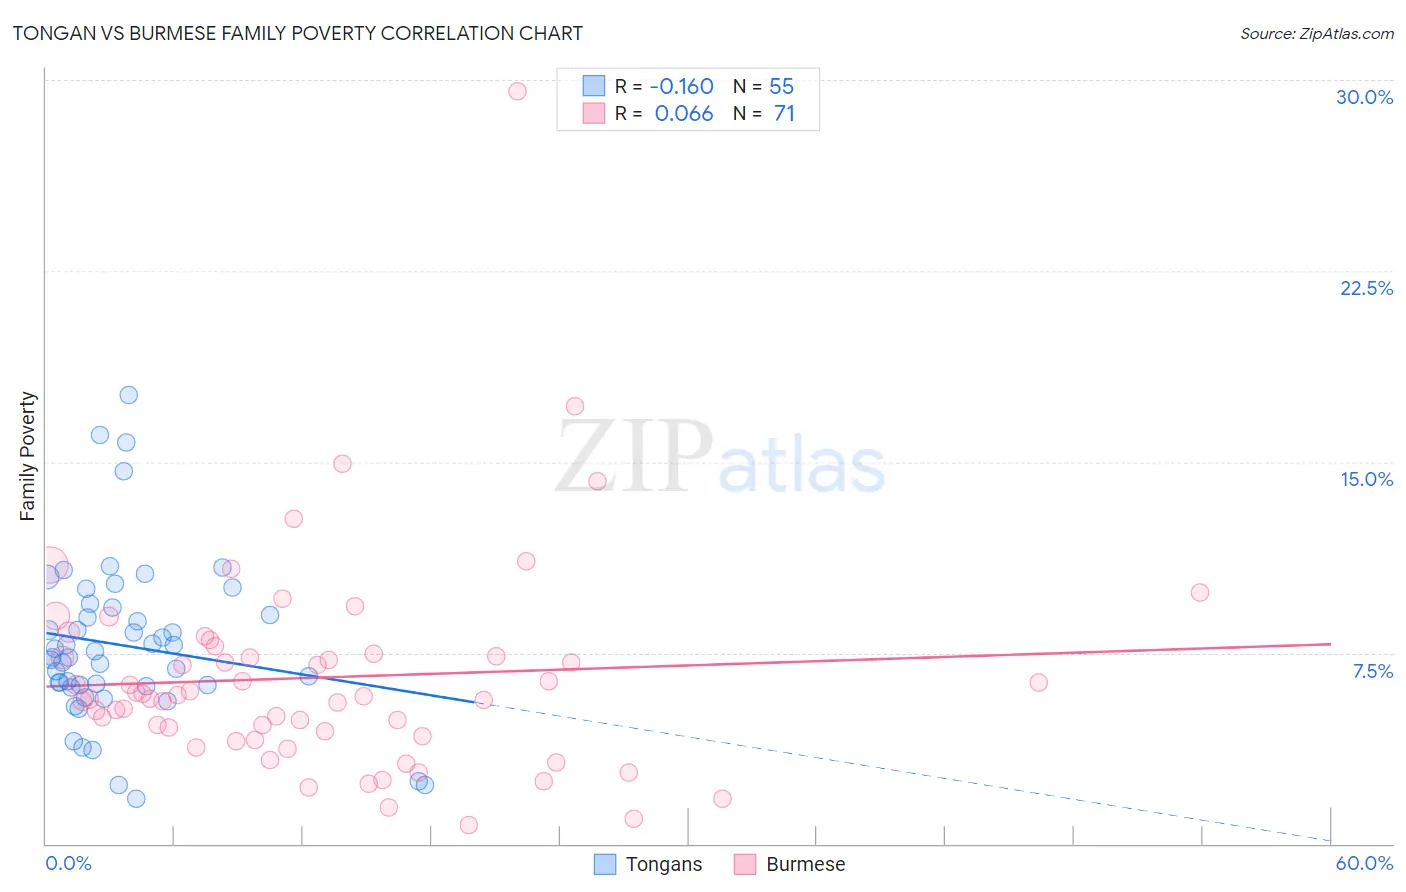
Tongan vs Burmese Family Poverty Correlation Chart

The statistical analysis conducted on geographies consisting of 102,821,565 people shows a poor negative correlation between the proportion of Tongans and poverty level among families in the United States with a correlation coefficient (R) of -0.160 and weighted average of 7.7%. Similarly, the statistical analysis conducted on geographies consisting of 463,380,335 people shows a slight positive correlation between the proportion of Burmese and poverty level among families in the United States with a correlation coefficient (R) of 0.066 and weighted average of 7.3%, a difference of 4.7%.
Tongan vs Burmese Family Poverty

Family Poverty Correlation Summary

MeasurementTonganBurmese
Minimum1.8%0.76%
Maximum17.6%29.5%
Range15.9%28.8%
Mean7.8%6.5%
Median7.3%5.8%
Interquartile 25% (IQ1)6.2%4.2%
Interquartile 75% (IQ3)9.3%7.5%
Interquartile Range (IQR)3.1%3.2%
Standard Deviation (Sample)3.2%4.2%
Standard Deviation (Population)3.2%4.2%

Similar Demographics by Family Poverty

Demographics Similar to Tongans by Family Poverty

In terms of family poverty, the demographic groups most similar to Tongans are Okinawan (7.7%, a difference of 0.010%), Immigrants from Czechoslovakia (7.7%, a difference of 0.010%), Immigrants from Sri Lanka (7.7%, a difference of 0.030%), German (7.7%, a difference of 0.14%), and Immigrants from Bolivia (7.7%, a difference of 0.22%).
DemographicsRating | RankFamily Poverty
Carpatho Rusyns
99.3
/100
|
#39
Exceptional
7.5%
Slovenes
99.3
/100
|
#40
Exceptional
7.5%
Immigrants | Australia
99.2
/100
|
#41
Exceptional
7.6%
Scandinavians
99.1
/100
|
#42
Exceptional
7.6%
Immigrants | Austria
99.1
/100
|
#43
Exceptional
7.6%
Germans
99.0
/100
|
#44
Exceptional
7.7%
Okinawans
98.9
/100
|
#45
Exceptional
7.7%
Tongans
98.9
/100
|
#46
Exceptional
7.7%
Immigrants | Czechoslovakia
98.9
/100
|
#47
Exceptional
7.7%
Immigrants | Sri Lanka
98.9
/100
|
#48
Exceptional
7.7%
Immigrants | Bolivia
98.9
/100
|
#49
Exceptional
7.7%
Immigrants | North Macedonia
98.9
/100
|
#50
Exceptional
7.7%
Immigrants | Moldova
98.8
/100
|
#51
Exceptional
7.7%
Indians (Asian)
98.8
/100
|
#52
Exceptional
7.7%
Swiss
98.8
/100
|
#53
Exceptional
7.7%

Demographics Similar to Burmese by Family Poverty

In terms of family poverty, the demographic groups most similar to Burmese are Croatian (7.3%, a difference of 0.0%), Cypriot (7.3%, a difference of 0.24%), Immigrants from Scotland (7.3%, a difference of 0.26%), Assyrian/Chaldean/Syriac (7.3%, a difference of 0.30%), and Danish (7.3%, a difference of 0.32%).
DemographicsRating | RankFamily Poverty
Immigrants | Lithuania
99.8
/100
|
#18
Exceptional
7.2%
Eastern Europeans
99.7
/100
|
#19
Exceptional
7.2%
Immigrants | Hong Kong
99.7
/100
|
#20
Exceptional
7.3%
Immigrants | Iran
99.7
/100
|
#21
Exceptional
7.3%
Danes
99.7
/100
|
#22
Exceptional
7.3%
Assyrians/Chaldeans/Syriacs
99.7
/100
|
#23
Exceptional
7.3%
Croatians
99.7
/100
|
#24
Exceptional
7.3%
Burmese
99.7
/100
|
#25
Exceptional
7.3%
Cypriots
99.6
/100
|
#26
Exceptional
7.3%
Immigrants | Scotland
99.6
/100
|
#27
Exceptional
7.3%
Immigrants | Korea
99.6
/100
|
#28
Exceptional
7.4%
Immigrants | Northern Europe
99.6
/100
|
#29
Exceptional
7.4%
Italians
99.6
/100
|
#30
Exceptional
7.4%
Czechs
99.6
/100
|
#31
Exceptional
7.4%
Poles
99.5
/100
|
#32
Exceptional
7.4%