Tlingit-Haida vs Malaysian Seniors Poverty Over the Age of 75

COMPARE

Tlingit-Haida
Race
Ancestry
AfghanAfricanAlaska NativeAlaskan AthabascanAlbanianAleutAlsatianAmericanApacheArabArapahoArgentineanArmenianAssyrian/Chaldean/SyriacAustralianAustrianBahamianBangladeshiBarbadianBasqueBelgianBelizeanBermudanBhutaneseBlackfeetBolivianBrazilianBritishBritish West IndianBulgarianBurmeseCajunCambodianCanadianCape VerdeanCarpatho RusynCelticCentral AmericanCentral American IndianCherokeeCheyenneChickasawChileanChineseChippewaChoctawColombianColvilleComancheCosta RicanCreeCreekCroatianCrowCubanCypriotCzechCzechoslovakianDanishDelawareDominicanDutchDutch West IndianEastern EuropeanEcuadorianEgyptianEnglishEstonianEthiopianEuropeanFijianFilipinoFinnishFrenchFrench American IndianFrench CanadianGermanGerman RussianGhanaianGreekGuamanian/ChamorroGuatemalanGuyaneseHaitianHmongHonduranHopiHoumaHungarianIcelanderIndian (Asian)IndonesianInupiatIranianIraqiIrishIroquoisIsraeliItalianJamaicanJapaneseJordanianKenyanKiowaKoreanLaotianLatvianLebaneseLiberianLithuanianLumbeeLuxembourgerMacedonianMalteseMarshalleseMenomineeMexicanMexican American IndianMongolianMoroccanNative HawaiianNavajoNepaleseNew ZealanderNicaraguanNigerianNorthern EuropeanNorwegianOkinawanOsageOttawaPaiutePakistaniPalestinianPanamanianParaguayanPennsylvania GermanPeruvianPimaPolishPortuguesePotawatomiPuebloPuerto RicanPuget Sound SalishRomanianRussianSalvadoranSamoanScandinavianScotch-IrishScottishSeminoleSenegaleseSerbianShoshoneSierra LeoneanSiouxSlavicSlovakSloveneSomaliSouth AfricanSouth AmericanSouth American IndianSoviet UnionSpaniardSpanishSpanish AmericanSpanish American IndianSri LankanSubsaharan AfricanSudaneseSwedishSwissSyrianTaiwaneseThaiTlingit-HaidaTohono O'OdhamTonganTrinidadian and TobagonianTsimshianTurkishU.S. Virgin IslanderUgandanUkrainianUruguayanUteVenezuelanVietnameseWelshWest IndianYakamaYaquiYugoslavianYumanYup'ikZimbabwean
Immigration
NonimmigrantsImmigrantsAfghanistanAfricaAlbaniaArgentinaArmeniaAsiaAustraliaAustriaBahamasBangladeshBarbadosBelarusBelgiumBelizeBoliviaBosnia and HerzegovinaBrazilBulgariaBurma/MyanmarCabo VerdeCambodiaCameroonCanadaCaribbeanCentral AmericaChileChinaColombiaCongoCosta RicaCroatiaCubaCzechoslovakiaDenmarkDominicaDominican RepublicEastern AfricaEastern AsiaEastern EuropeEcuadorEgyptEl SalvadorEnglandEritreaEthiopiaEuropeFijiFranceGermanyGhanaGreeceGrenadaGuatemalaGuyanaHaitiHondurasHong KongHungaryIndiaIndonesiaIranIraqIrelandIsraelItalyJamaicaJapanJordanKazakhstanKenyaKoreaKuwaitLaosLatin AmericaLatviaLebanonLiberiaLithuaniaMalaysiaMexicoMicronesiaMiddle AfricaMoldovaMoroccoNepalNetherlandsNicaraguaNigeriaNorth AmericaNorth MacedoniaNorthern AfricaNorthern EuropeNorwayOceaniaPakistanPanamaPeruPhilippinesPolandPortugalRomaniaRussiaSaudi ArabiaScotlandSenegalSerbiaSierra LeoneSingaporeSomaliaSouth AfricaSouth AmericaSouth Central AsiaSouth Eastern AsiaSouthern EuropeSpainSri LankaSt. Vincent and the GrenadinesSudanSwedenSwitzerlandSyriaTaiwanThailandTrinidad and TobagoTurkeyUgandaUkraineUruguayUzbekistanVenezuelaVietnamWest IndiesWestern AfricaWestern AsiaWestern EuropeYemenZaireZimbabweAzores
Malaysian
Race
Ancestry
AfghanAfricanAlaska NativeAlaskan AthabascanAlbanianAleutAlsatianAmericanApacheArabArapahoArgentineanArmenianAssyrian/Chaldean/SyriacAustralianAustrianBahamianBangladeshiBarbadianBasqueBelgianBelizeanBermudanBhutaneseBlackfeetBolivianBrazilianBritishBritish West IndianBulgarianBurmeseCajunCambodianCanadianCape VerdeanCarpatho RusynCelticCentral AmericanCentral American IndianCherokeeCheyenneChickasawChileanChineseChippewaChoctawColombianColvilleComancheCosta RicanCreeCreekCroatianCrowCubanCypriotCzechCzechoslovakianDanishDelawareDominicanDutchDutch West IndianEastern EuropeanEcuadorianEgyptianEnglishEstonianEthiopianEuropeanFijianFilipinoFinnishFrenchFrench American IndianFrench CanadianGermanGerman RussianGhanaianGreekGuamanian/ChamorroGuatemalanGuyaneseHaitianHmongHonduranHopiHoumaHungarianIcelanderIndian (Asian)IndonesianInupiatIranianIraqiIrishIroquoisIsraeliItalianJamaicanJapaneseJordanianKenyanKiowaKoreanLaotianLatvianLebaneseLiberianLithuanianLumbeeLuxembourgerMacedonianMalaysianMalteseMarshalleseMenomineeMexicanMexican American IndianMongolianMoroccanNative HawaiianNavajoNepaleseNew ZealanderNicaraguanNigerianNorthern EuropeanNorwegianOkinawanOsageOttawaPaiutePakistaniPalestinianPanamanianParaguayanPennsylvania GermanPeruvianPimaPolishPortuguesePotawatomiPuebloPuerto RicanPuget Sound SalishRomanianRussianSalvadoranSamoanScandinavianScotch-IrishScottishSeminoleSenegaleseSerbianShoshoneSierra LeoneanSiouxSlavicSlovakSloveneSomaliSouth AfricanSouth AmericanSouth American IndianSoviet UnionSpaniardSpanishSpanish AmericanSpanish American IndianSri LankanSubsaharan AfricanSudaneseSwedishSwissSyrianTaiwaneseThaiTohono O'OdhamTonganTrinidadian and TobagonianTsimshianTurkishU.S. Virgin IslanderUgandanUkrainianUruguayanUteVenezuelanVietnameseWelshWest IndianYakamaYaquiYugoslavianYumanYup'ikZimbabwean
Immigration
NonimmigrantsImmigrantsAfghanistanAfricaAlbaniaArgentinaArmeniaAsiaAustraliaAustriaBahamasBangladeshBarbadosBelarusBelgiumBelizeBoliviaBosnia and HerzegovinaBrazilBulgariaBurma/MyanmarCabo VerdeCambodiaCameroonCanadaCaribbeanCentral AmericaChileChinaColombiaCongoCosta RicaCroatiaCubaCzechoslovakiaDenmarkDominicaDominican RepublicEastern AfricaEastern AsiaEastern EuropeEcuadorEgyptEl SalvadorEnglandEritreaEthiopiaEuropeFijiFranceGermanyGhanaGreeceGrenadaGuatemalaGuyanaHaitiHondurasHong KongHungaryIndiaIndonesiaIranIraqIrelandIsraelItalyJamaicaJapanJordanKazakhstanKenyaKoreaKuwaitLaosLatin AmericaLatviaLebanonLiberiaLithuaniaMalaysiaMexicoMicronesiaMiddle AfricaMoldovaMoroccoNepalNetherlandsNicaraguaNigeriaNorth AmericaNorth MacedoniaNorthern AfricaNorthern EuropeNorwayOceaniaPakistanPanamaPeruPhilippinesPolandPortugalRomaniaRussiaSaudi ArabiaScotlandSenegalSerbiaSierra LeoneSingaporeSomaliaSouth AfricaSouth AmericaSouth Central AsiaSouth Eastern AsiaSouthern EuropeSpainSri LankaSt. Vincent and the GrenadinesSudanSwedenSwitzerlandSyriaTaiwanThailandTrinidad and TobagoTurkeyUgandaUkraineUruguayUzbekistanVenezuelaVietnamWest IndiesWestern AfricaWestern AsiaWestern EuropeYemenZaireZimbabweAzores
Seniors Poverty Over the Age of 75
Income
Poverty
Unemployment
Labor Participation
Family Structure
Vehicle Availability
Education Level
Disability

Seniors Poverty Over the Age of 75 Comparison

Tlingit-Haida

Malaysians

Exceptional
Excellent
9.7%
SENIORS POVERTY OVER THE AGE OF 75
100.0/ 100
METRIC RATING
2nd/ 347
METRIC RANK
11.8%
SENIORS POVERTY OVER THE AGE OF 75
84.1/ 100
METRIC RATING
121st/ 347
METRIC RANK

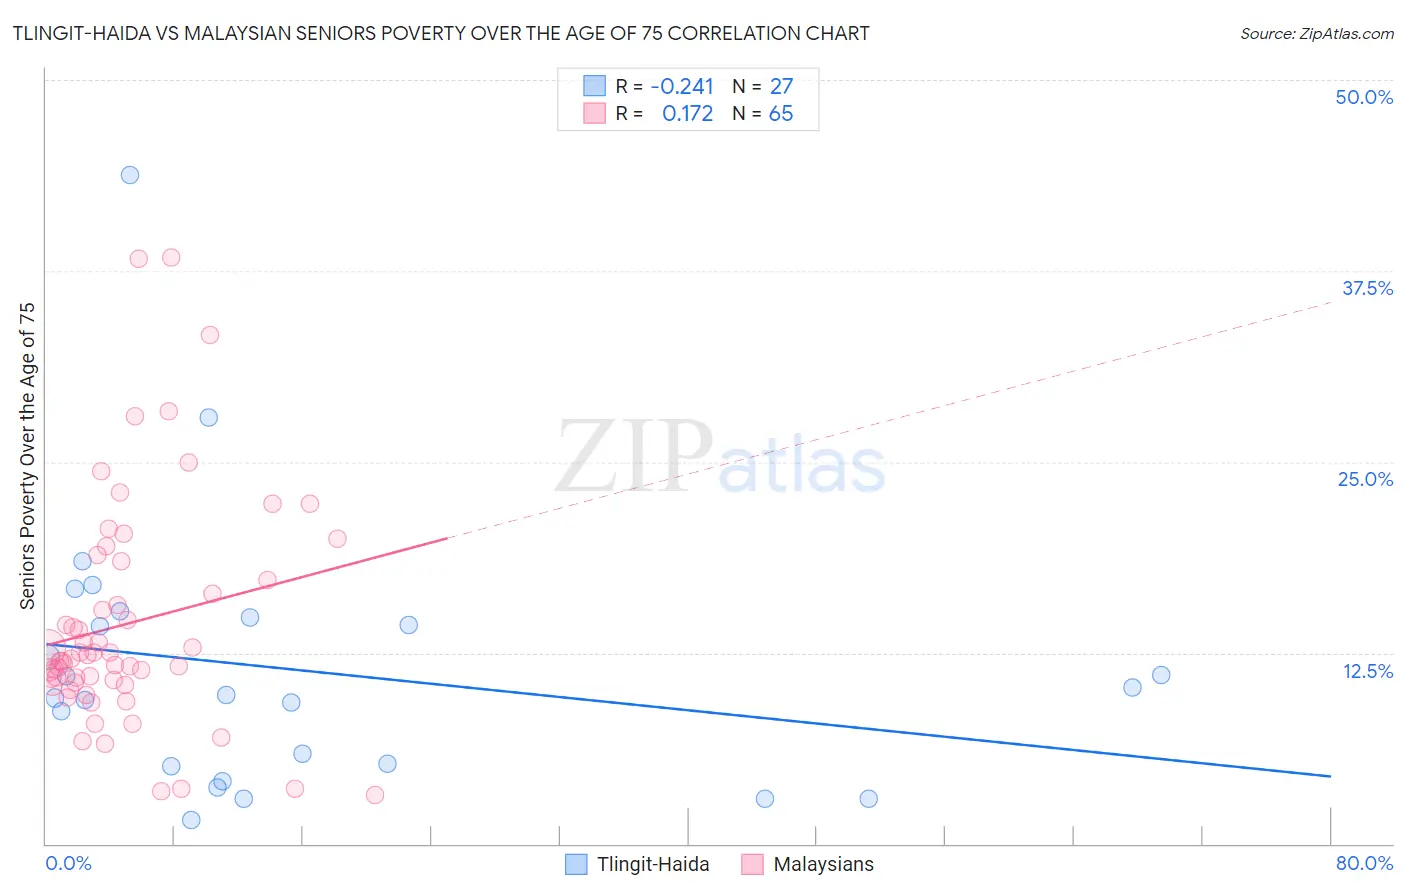
Tlingit-Haida vs Malaysian Seniors Poverty Over the Age of 75 Correlation Chart

The statistical analysis conducted on geographies consisting of 60,526,405 people shows a weak negative correlation between the proportion of Tlingit-Haida and poverty level among seniors over the age of 75 in the United States with a correlation coefficient (R) of -0.241 and weighted average of 9.7%. Similarly, the statistical analysis conducted on geographies consisting of 224,603,376 people shows a poor positive correlation between the proportion of Malaysians and poverty level among seniors over the age of 75 in the United States with a correlation coefficient (R) of 0.172 and weighted average of 11.8%, a difference of 21.4%.
Tlingit-Haida vs Malaysian Seniors Poverty Over the Age of 75

Seniors Poverty Over the Age of 75 Correlation Summary

MeasurementTlingit-HaidaMalaysian
Minimum1.5%3.2%
Maximum43.8%38.4%
Range42.2%35.2%
Mean11.4%14.4%
Median9.7%12.1%
Interquartile 25% (IQ1)5.0%10.5%
Interquartile 75% (IQ3)14.8%17.9%
Interquartile Range (IQR)9.8%7.4%
Standard Deviation (Sample)8.8%7.4%
Standard Deviation (Population)8.7%7.4%

Similar Demographics by Seniors Poverty Over the Age of 75

Demographics Similar to Tlingit-Haida by Seniors Poverty Over the Age of 75

In terms of seniors poverty over the age of 75, the demographic groups most similar to Tlingit-Haida are Native Hawaiian (10.1%, a difference of 3.8%), Swedish (10.2%, a difference of 4.7%), Norwegian (10.2%, a difference of 5.1%), Danish (10.2%, a difference of 5.4%), and Maltese (10.3%, a difference of 6.1%).
DemographicsRating | RankSeniors Poverty Over the Age of 75
Chinese
100.0
/100
|
#1
Exceptional
9.1%
Tlingit-Haida
100.0
/100
|
#2
Exceptional
9.7%
Native Hawaiians
100.0
/100
|
#3
Exceptional
10.1%
Swedes
100.0
/100
|
#4
Exceptional
10.2%
Norwegians
100.0
/100
|
#5
Exceptional
10.2%
Danes
100.0
/100
|
#6
Exceptional
10.2%
Maltese
100.0
/100
|
#7
Exceptional
10.3%
Germans
99.9
/100
|
#8
Exceptional
10.4%
English
99.9
/100
|
#9
Exceptional
10.4%
Scandinavians
99.9
/100
|
#10
Exceptional
10.4%
Immigrants | India
99.9
/100
|
#11
Exceptional
10.4%
Tongans
99.9
/100
|
#12
Exceptional
10.5%
Croatians
99.9
/100
|
#13
Exceptional
10.5%
Scottish
99.9
/100
|
#14
Exceptional
10.5%
Europeans
99.9
/100
|
#15
Exceptional
10.5%

Demographics Similar to Malaysians by Seniors Poverty Over the Age of 75

In terms of seniors poverty over the age of 75, the demographic groups most similar to Malaysians are Pakistani (11.8%, a difference of 0.010%), Immigrants from Italy (11.8%, a difference of 0.010%), Fijian (11.8%, a difference of 0.040%), Sudanese (11.8%, a difference of 0.070%), and Immigrants from Nepal (11.8%, a difference of 0.080%).
DemographicsRating | RankSeniors Poverty Over the Age of 75
Ukrainians
86.9
/100
|
#114
Excellent
11.7%
New Zealanders
86.3
/100
|
#115
Excellent
11.7%
Iraqis
86.3
/100
|
#116
Excellent
11.7%
Icelanders
85.7
/100
|
#117
Excellent
11.7%
Immigrants | Zimbabwe
85.5
/100
|
#118
Excellent
11.7%
Immigrants | Uganda
84.8
/100
|
#119
Excellent
11.8%
Immigrants | Nepal
84.5
/100
|
#120
Excellent
11.8%
Malaysians
84.1
/100
|
#121
Excellent
11.8%
Pakistanis
84.0
/100
|
#122
Excellent
11.8%
Immigrants | Italy
84.0
/100
|
#123
Excellent
11.8%
Fijians
83.8
/100
|
#124
Excellent
11.8%
Sudanese
83.6
/100
|
#125
Excellent
11.8%
Pennsylvania Germans
83.4
/100
|
#126
Excellent
11.8%
Immigrants | Denmark
82.6
/100
|
#127
Excellent
11.8%
Immigrants | Hungary
81.7
/100
|
#128
Excellent
11.8%