Mongolian vs Malaysian Seniors Poverty Over the Age of 75

COMPARE

Mongolian
Race
Ancestry
AfghanAfricanAlaska NativeAlaskan AthabascanAlbanianAleutAlsatianAmericanApacheArabArapahoArgentineanArmenianAssyrian/Chaldean/SyriacAustralianAustrianBahamianBangladeshiBarbadianBasqueBelgianBelizeanBermudanBhutaneseBlackfeetBolivianBrazilianBritishBritish West IndianBulgarianBurmeseCajunCambodianCanadianCape VerdeanCarpatho RusynCelticCentral AmericanCentral American IndianCherokeeCheyenneChickasawChileanChineseChippewaChoctawColombianColvilleComancheCosta RicanCreeCreekCroatianCrowCubanCypriotCzechCzechoslovakianDanishDelawareDominicanDutchDutch West IndianEastern EuropeanEcuadorianEgyptianEnglishEstonianEthiopianEuropeanFijianFilipinoFinnishFrenchFrench American IndianFrench CanadianGermanGerman RussianGhanaianGreekGuamanian/ChamorroGuatemalanGuyaneseHaitianHmongHonduranHopiHoumaHungarianIcelanderIndian (Asian)IndonesianInupiatIranianIraqiIrishIroquoisIsraeliItalianJamaicanJapaneseJordanianKenyanKiowaKoreanLaotianLatvianLebaneseLiberianLithuanianLumbeeLuxembourgerMacedonianMalteseMarshalleseMenomineeMexicanMexican American IndianMongolianMoroccanNative HawaiianNavajoNepaleseNew ZealanderNicaraguanNigerianNorthern EuropeanNorwegianOkinawanOsageOttawaPaiutePakistaniPalestinianPanamanianParaguayanPennsylvania GermanPeruvianPimaPolishPortuguesePotawatomiPuebloPuerto RicanPuget Sound SalishRomanianRussianSalvadoranSamoanScandinavianScotch-IrishScottishSeminoleSenegaleseSerbianShoshoneSierra LeoneanSiouxSlavicSlovakSloveneSomaliSouth AfricanSouth AmericanSouth American IndianSoviet UnionSpaniardSpanishSpanish AmericanSpanish American IndianSri LankanSubsaharan AfricanSudaneseSwedishSwissSyrianTaiwaneseThaiTlingit-HaidaTohono O'OdhamTonganTrinidadian and TobagonianTsimshianTurkishU.S. Virgin IslanderUgandanUkrainianUruguayanUteVenezuelanVietnameseWelshWest IndianYakamaYaquiYugoslavianYumanYup'ikZimbabwean
Immigration
NonimmigrantsImmigrantsAfghanistanAfricaAlbaniaArgentinaArmeniaAsiaAustraliaAustriaBahamasBangladeshBarbadosBelarusBelgiumBelizeBoliviaBosnia and HerzegovinaBrazilBulgariaBurma/MyanmarCabo VerdeCambodiaCameroonCanadaCaribbeanCentral AmericaChileChinaColombiaCongoCosta RicaCroatiaCubaCzechoslovakiaDenmarkDominicaDominican RepublicEastern AfricaEastern AsiaEastern EuropeEcuadorEgyptEl SalvadorEnglandEritreaEthiopiaEuropeFijiFranceGermanyGhanaGreeceGrenadaGuatemalaGuyanaHaitiHondurasHong KongHungaryIndiaIndonesiaIranIraqIrelandIsraelItalyJamaicaJapanJordanKazakhstanKenyaKoreaKuwaitLaosLatin AmericaLatviaLebanonLiberiaLithuaniaMalaysiaMexicoMicronesiaMiddle AfricaMoldovaMoroccoNepalNetherlandsNicaraguaNigeriaNorth AmericaNorth MacedoniaNorthern AfricaNorthern EuropeNorwayOceaniaPakistanPanamaPeruPhilippinesPolandPortugalRomaniaRussiaSaudi ArabiaScotlandSenegalSerbiaSierra LeoneSingaporeSomaliaSouth AfricaSouth AmericaSouth Central AsiaSouth Eastern AsiaSouthern EuropeSpainSri LankaSt. Vincent and the GrenadinesSudanSwedenSwitzerlandSyriaTaiwanThailandTrinidad and TobagoTurkeyUgandaUkraineUruguayUzbekistanVenezuelaVietnamWest IndiesWestern AfricaWestern AsiaWestern EuropeYemenZaireZimbabweAzores
Malaysian
Race
Ancestry
AfghanAfricanAlaska NativeAlaskan AthabascanAlbanianAleutAlsatianAmericanApacheArabArapahoArgentineanArmenianAssyrian/Chaldean/SyriacAustralianAustrianBahamianBangladeshiBarbadianBasqueBelgianBelizeanBermudanBhutaneseBlackfeetBolivianBrazilianBritishBritish West IndianBulgarianBurmeseCajunCambodianCanadianCape VerdeanCarpatho RusynCelticCentral AmericanCentral American IndianCherokeeCheyenneChickasawChileanChineseChippewaChoctawColombianColvilleComancheCosta RicanCreeCreekCroatianCrowCubanCypriotCzechCzechoslovakianDanishDelawareDominicanDutchDutch West IndianEastern EuropeanEcuadorianEgyptianEnglishEstonianEthiopianEuropeanFijianFilipinoFinnishFrenchFrench American IndianFrench CanadianGermanGerman RussianGhanaianGreekGuamanian/ChamorroGuatemalanGuyaneseHaitianHmongHonduranHopiHoumaHungarianIcelanderIndian (Asian)IndonesianInupiatIranianIraqiIrishIroquoisIsraeliItalianJamaicanJapaneseJordanianKenyanKiowaKoreanLaotianLatvianLebaneseLiberianLithuanianLumbeeLuxembourgerMacedonianMalaysianMalteseMarshalleseMenomineeMexicanMexican American IndianMoroccanNative HawaiianNavajoNepaleseNew ZealanderNicaraguanNigerianNorthern EuropeanNorwegianOkinawanOsageOttawaPaiutePakistaniPalestinianPanamanianParaguayanPennsylvania GermanPeruvianPimaPolishPortuguesePotawatomiPuebloPuerto RicanPuget Sound SalishRomanianRussianSalvadoranSamoanScandinavianScotch-IrishScottishSeminoleSenegaleseSerbianShoshoneSierra LeoneanSiouxSlavicSlovakSloveneSomaliSouth AfricanSouth AmericanSouth American IndianSoviet UnionSpaniardSpanishSpanish AmericanSpanish American IndianSri LankanSubsaharan AfricanSudaneseSwedishSwissSyrianTaiwaneseThaiTlingit-HaidaTohono O'OdhamTonganTrinidadian and TobagonianTsimshianTurkishU.S. Virgin IslanderUgandanUkrainianUruguayanUteVenezuelanVietnameseWelshWest IndianYakamaYaquiYugoslavianYumanYup'ikZimbabwean
Immigration
NonimmigrantsImmigrantsAfghanistanAfricaAlbaniaArgentinaArmeniaAsiaAustraliaAustriaBahamasBangladeshBarbadosBelarusBelgiumBelizeBoliviaBosnia and HerzegovinaBrazilBulgariaBurma/MyanmarCabo VerdeCambodiaCameroonCanadaCaribbeanCentral AmericaChileChinaColombiaCongoCosta RicaCroatiaCubaCzechoslovakiaDenmarkDominicaDominican RepublicEastern AfricaEastern AsiaEastern EuropeEcuadorEgyptEl SalvadorEnglandEritreaEthiopiaEuropeFijiFranceGermanyGhanaGreeceGrenadaGuatemalaGuyanaHaitiHondurasHong KongHungaryIndiaIndonesiaIranIraqIrelandIsraelItalyJamaicaJapanJordanKazakhstanKenyaKoreaKuwaitLaosLatin AmericaLatviaLebanonLiberiaLithuaniaMalaysiaMexicoMicronesiaMiddle AfricaMoldovaMoroccoNepalNetherlandsNicaraguaNigeriaNorth AmericaNorth MacedoniaNorthern AfricaNorthern EuropeNorwayOceaniaPakistanPanamaPeruPhilippinesPolandPortugalRomaniaRussiaSaudi ArabiaScotlandSenegalSerbiaSierra LeoneSingaporeSomaliaSouth AfricaSouth AmericaSouth Central AsiaSouth Eastern AsiaSouthern EuropeSpainSri LankaSt. Vincent and the GrenadinesSudanSwedenSwitzerlandSyriaTaiwanThailandTrinidad and TobagoTurkeyUgandaUkraineUruguayUzbekistanVenezuelaVietnamWest IndiesWestern AfricaWestern AsiaWestern EuropeYemenZaireZimbabweAzores
Seniors Poverty Over the Age of 75
Income
Poverty
Unemployment
Labor Participation
Family Structure
Vehicle Availability
Education Level
Disability

Seniors Poverty Over the Age of 75 Comparison

Mongolians

Malaysians

Average
Excellent
12.2%
SENIORS POVERTY OVER THE AGE OF 75
45.5/ 100
METRIC RATING
179th/ 347
METRIC RANK
11.8%
SENIORS POVERTY OVER THE AGE OF 75
84.1/ 100
METRIC RATING
121st/ 347
METRIC RANK

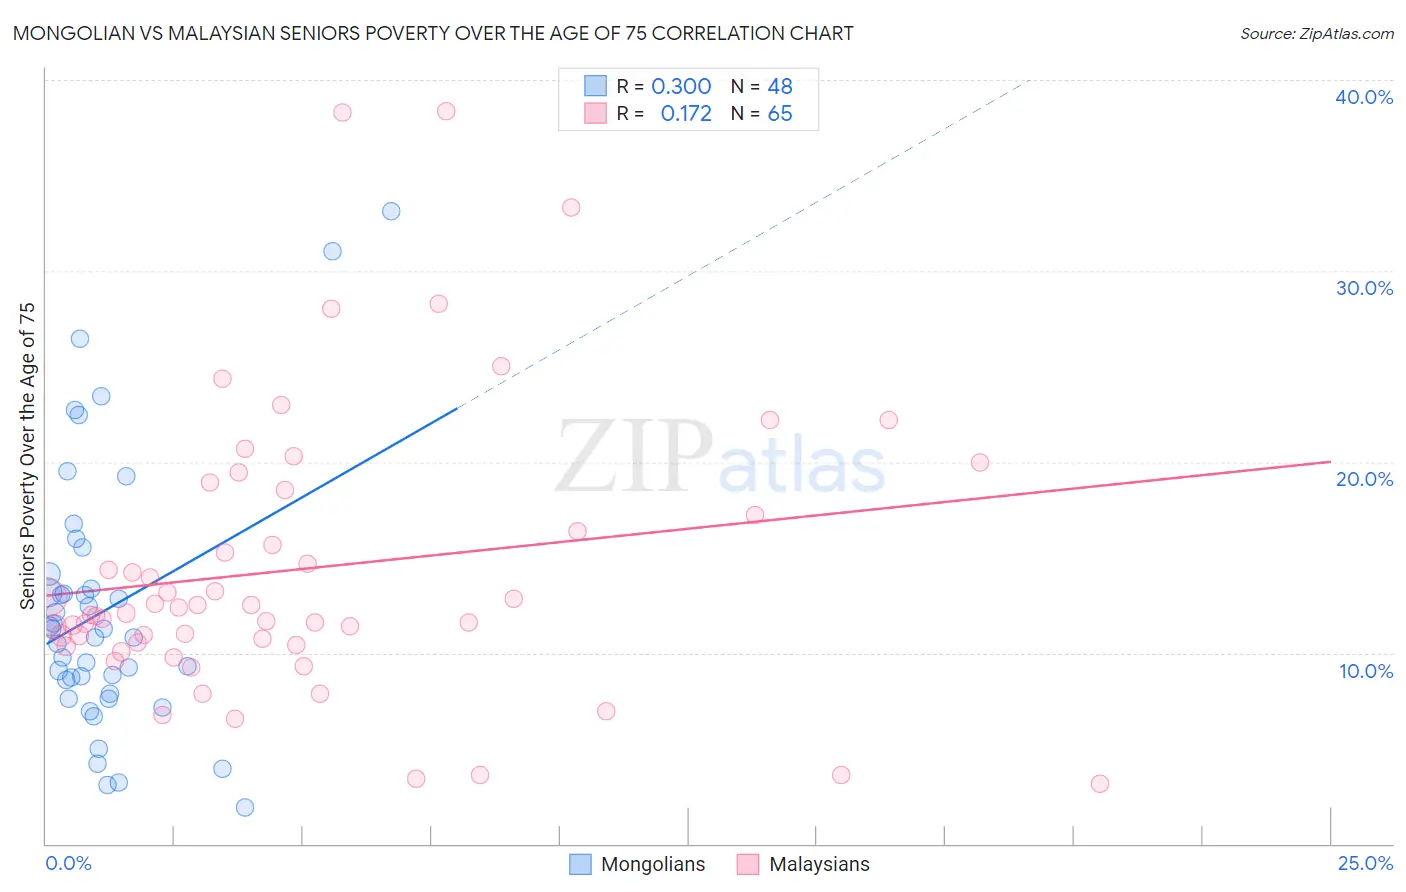
Mongolian vs Malaysian Seniors Poverty Over the Age of 75 Correlation Chart

The statistical analysis conducted on geographies consisting of 139,832,325 people shows a weak positive correlation between the proportion of Mongolians and poverty level among seniors over the age of 75 in the United States with a correlation coefficient (R) of 0.300 and weighted average of 12.2%. Similarly, the statistical analysis conducted on geographies consisting of 224,603,376 people shows a poor positive correlation between the proportion of Malaysians and poverty level among seniors over the age of 75 in the United States with a correlation coefficient (R) of 0.172 and weighted average of 11.8%, a difference of 3.9%.
Mongolian vs Malaysian Seniors Poverty Over the Age of 75

Seniors Poverty Over the Age of 75 Correlation Summary

MeasurementMongolianMalaysian
Minimum1.9%3.2%
Maximum33.1%38.4%
Range31.3%35.2%
Mean12.2%14.4%
Median11.0%12.1%
Interquartile 25% (IQ1)8.2%10.5%
Interquartile 75% (IQ3)13.7%17.9%
Interquartile Range (IQR)5.5%7.4%
Standard Deviation (Sample)6.8%7.4%
Standard Deviation (Population)6.8%7.4%

Similar Demographics by Seniors Poverty Over the Age of 75

Demographics Similar to Mongolians by Seniors Poverty Over the Age of 75

In terms of seniors poverty over the age of 75, the demographic groups most similar to Mongolians are Immigrants from South Eastern Asia (12.2%, a difference of 0.10%), Nonimmigrants (12.2%, a difference of 0.11%), Immigrants from Australia (12.2%, a difference of 0.11%), Immigrants from Asia (12.2%, a difference of 0.19%), and Immigrants from Iran (12.2%, a difference of 0.21%).
DemographicsRating | RankSeniors Poverty Over the Age of 75
Immigrants | Fiji
51.5
/100
|
#172
Average
12.2%
Arabs
50.5
/100
|
#173
Average
12.2%
Immigrants | Europe
50.0
/100
|
#174
Average
12.2%
Immigrants | Saudi Arabia
49.5
/100
|
#175
Average
12.2%
Immigrants | Iran
48.1
/100
|
#176
Average
12.2%
Immigrants | Asia
47.8
/100
|
#177
Average
12.2%
Immigrants | Nonimmigrants
46.8
/100
|
#178
Average
12.2%
Mongolians
45.5
/100
|
#179
Average
12.2%
Immigrants | South Eastern Asia
44.3
/100
|
#180
Average
12.2%
Immigrants | Australia
44.2
/100
|
#181
Average
12.2%
German Russians
41.4
/100
|
#182
Average
12.3%
Laotians
38.2
/100
|
#183
Fair
12.3%
Kiowa
36.0
/100
|
#184
Fair
12.3%
Immigrants | Malaysia
35.8
/100
|
#185
Fair
12.3%
Sri Lankans
32.3
/100
|
#186
Fair
12.4%

Demographics Similar to Malaysians by Seniors Poverty Over the Age of 75

In terms of seniors poverty over the age of 75, the demographic groups most similar to Malaysians are Pakistani (11.8%, a difference of 0.010%), Immigrants from Italy (11.8%, a difference of 0.010%), Fijian (11.8%, a difference of 0.040%), Sudanese (11.8%, a difference of 0.070%), and Immigrants from Nepal (11.8%, a difference of 0.080%).
DemographicsRating | RankSeniors Poverty Over the Age of 75
Ukrainians
86.9
/100
|
#114
Excellent
11.7%
New Zealanders
86.3
/100
|
#115
Excellent
11.7%
Iraqis
86.3
/100
|
#116
Excellent
11.7%
Icelanders
85.7
/100
|
#117
Excellent
11.7%
Immigrants | Zimbabwe
85.5
/100
|
#118
Excellent
11.7%
Immigrants | Uganda
84.8
/100
|
#119
Excellent
11.8%
Immigrants | Nepal
84.5
/100
|
#120
Excellent
11.8%
Malaysians
84.1
/100
|
#121
Excellent
11.8%
Pakistanis
84.0
/100
|
#122
Excellent
11.8%
Immigrants | Italy
84.0
/100
|
#123
Excellent
11.8%
Fijians
83.8
/100
|
#124
Excellent
11.8%
Sudanese
83.6
/100
|
#125
Excellent
11.8%
Pennsylvania Germans
83.4
/100
|
#126
Excellent
11.8%
Immigrants | Denmark
82.6
/100
|
#127
Excellent
11.8%
Immigrants | Hungary
81.7
/100
|
#128
Excellent
11.8%