Thai vs Immigrants from Netherlands Single Mother Poverty
COMPARE
Thai
Immigrants from Netherlands
Single Mother Poverty
Single Mother Poverty Comparison
Thais
Immigrants from Netherlands
24.5%
SINGLE MOTHER POVERTY
100.0/ 100
METRIC RATING
6th/ 347
METRIC RANK
27.9%
SINGLE MOTHER POVERTY
97.2/ 100
METRIC RATING
99th/ 347
METRIC RANK
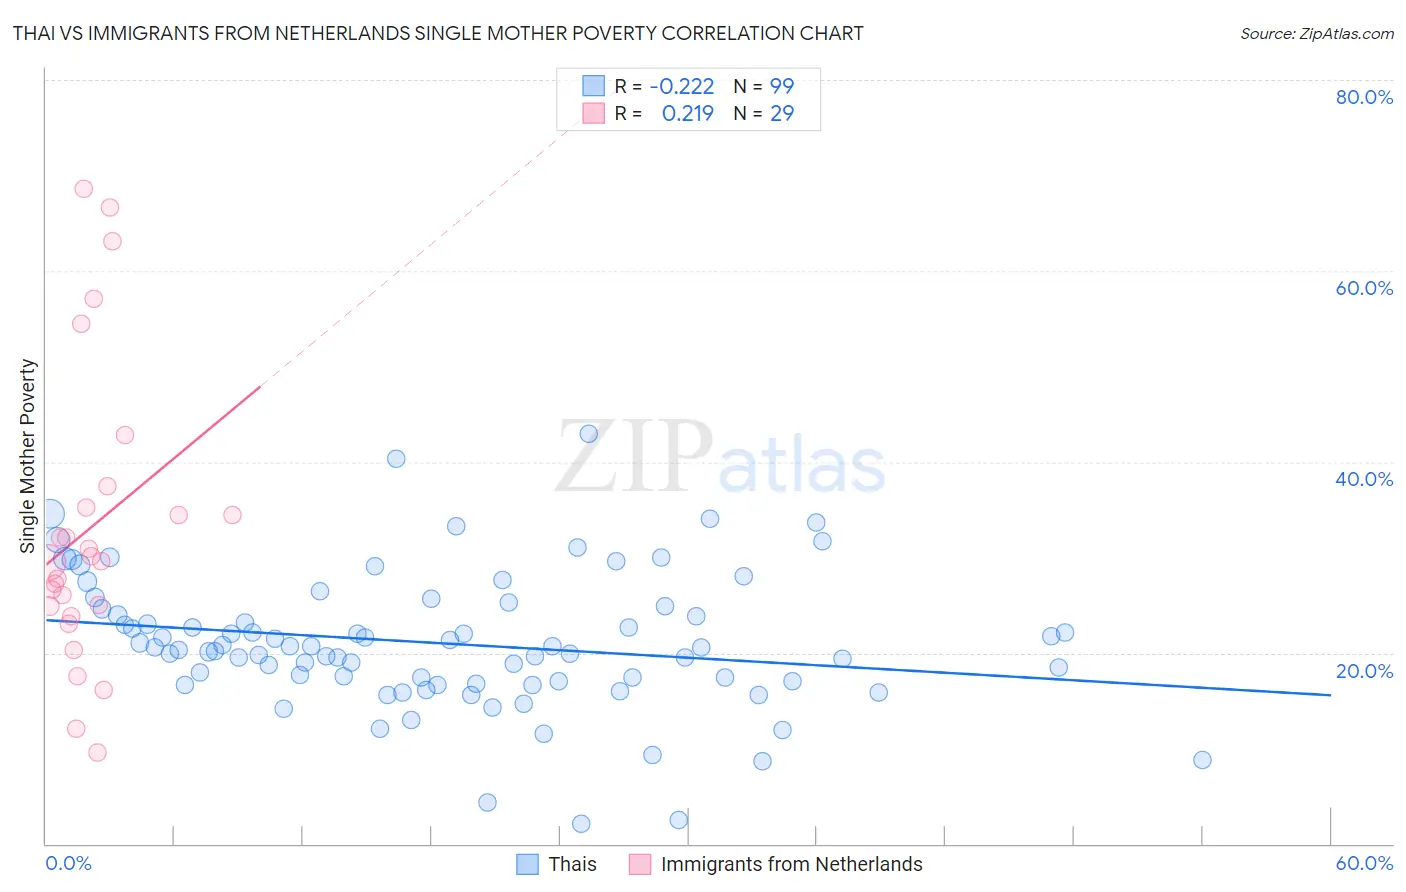
Thai vs Immigrants from Netherlands Single Mother Poverty Correlation Chart
The statistical analysis conducted on geographies consisting of 460,866,767 people shows a weak negative correlation between the proportion of Thais and poverty level among single mothers in the United States with a correlation coefficient (R) of -0.222 and weighted average of 24.5%. Similarly, the statistical analysis conducted on geographies consisting of 233,130,258 people shows a weak positive correlation between the proportion of Immigrants from Netherlands and poverty level among single mothers in the United States with a correlation coefficient (R) of 0.219 and weighted average of 27.9%, a difference of 14.1%.
Single Mother Poverty Correlation Summary
| Measurement | Thai | Immigrants from Netherlands |
| Minimum | 2.0% | 9.6% |
| Maximum | 43.0% | 68.6% |
| Range | 41.0% | 59.0% |
| Mean | 21.0% | 33.1% |
| Median | 20.5% | 29.6% |
| Interquartile 25% (IQ1) | 17.1% | 24.3% |
| Interquartile 75% (IQ3) | 24.6% | 36.4% |
| Interquartile Range (IQR) | 7.6% | 12.0% |
| Standard Deviation (Sample) | 7.1% | 15.4% |
| Standard Deviation (Population) | 7.1% | 15.1% |
Similar Demographics by Single Mother Poverty
Demographics Similar to Thais by Single Mother Poverty
In terms of single mother poverty, the demographic groups most similar to Thais are Immigrants from Hong Kong (24.4%, a difference of 0.49%), Chinese (24.6%, a difference of 0.54%), Filipino (24.3%, a difference of 0.72%), Immigrants from Iran (25.1%, a difference of 2.5%), and Immigrants from Taiwan (23.9%, a difference of 2.7%).
| Demographics | Rating | Rank | Single Mother Poverty |
| Assyrians/Chaldeans/Syriacs | 100.0 /100 | #1 | Exceptional 23.8% |
| Immigrants | India | 100.0 /100 | #2 | Exceptional 23.8% |
| Immigrants | Taiwan | 100.0 /100 | #3 | Exceptional 23.9% |
| Filipinos | 100.0 /100 | #4 | Exceptional 24.3% |
| Immigrants | Hong Kong | 100.0 /100 | #5 | Exceptional 24.4% |
| Thais | 100.0 /100 | #6 | Exceptional 24.5% |
| Chinese | 100.0 /100 | #7 | Exceptional 24.6% |
| Immigrants | Iran | 100.0 /100 | #8 | Exceptional 25.1% |
| Immigrants | Lithuania | 100.0 /100 | #9 | Exceptional 25.2% |
| Immigrants | South Central Asia | 100.0 /100 | #10 | Exceptional 25.3% |
| Iranians | 100.0 /100 | #11 | Exceptional 25.5% |
| Bhutanese | 100.0 /100 | #12 | Exceptional 25.6% |
| Indians (Asian) | 100.0 /100 | #13 | Exceptional 25.8% |
| Immigrants | Singapore | 100.0 /100 | #14 | Exceptional 25.8% |
| Immigrants | Ireland | 100.0 /100 | #15 | Exceptional 25.8% |
Demographics Similar to Immigrants from Netherlands by Single Mother Poverty
In terms of single mother poverty, the demographic groups most similar to Immigrants from Netherlands are Immigrants from Nepal (27.9%, a difference of 0.010%), Immigrants from Brazil (27.9%, a difference of 0.020%), Zimbabwean (27.9%, a difference of 0.050%), Immigrants from Iraq (27.9%, a difference of 0.060%), and Pakistani (28.0%, a difference of 0.11%).
| Demographics | Rating | Rank | Single Mother Poverty |
| Estonians | 97.9 /100 | #92 | Exceptional 27.8% |
| Romanians | 97.8 /100 | #93 | Exceptional 27.8% |
| Albanians | 97.6 /100 | #94 | Exceptional 27.9% |
| Chileans | 97.5 /100 | #95 | Exceptional 27.9% |
| Immigrants | Iraq | 97.3 /100 | #96 | Exceptional 27.9% |
| Immigrants | Brazil | 97.2 /100 | #97 | Exceptional 27.9% |
| Immigrants | Nepal | 97.2 /100 | #98 | Exceptional 27.9% |
| Immigrants | Netherlands | 97.2 /100 | #99 | Exceptional 27.9% |
| Zimbabweans | 97.1 /100 | #100 | Exceptional 27.9% |
| Pakistanis | 96.9 /100 | #101 | Exceptional 28.0% |
| Immigrants | Croatia | 96.7 /100 | #102 | Exceptional 28.0% |
| Immigrants | Northern Africa | 96.6 /100 | #103 | Exceptional 28.0% |
| Italians | 96.6 /100 | #104 | Exceptional 28.0% |
| Israelis | 96.5 /100 | #105 | Exceptional 28.0% |
| Ukrainians | 96.4 /100 | #106 | Exceptional 28.0% |