Subsaharan African vs Immigrants from Turkey Female Poverty Among 25-34 Year Olds
COMPARE
Subsaharan African
Immigrants from Turkey
Female Poverty Among 25-34 Year Olds
Female Poverty Among 25-34 Year Olds Comparison
Sub-Saharan Africans
Immigrants from Turkey
15.6%
FEMALE POVERTY AMONG 25-34 YEAR OLDS
0.1/ 100
METRIC RATING
269th/ 347
METRIC RANK
11.9%
FEMALE POVERTY AMONG 25-34 YEAR OLDS
99.7/ 100
METRIC RATING
42nd/ 347
METRIC RANK
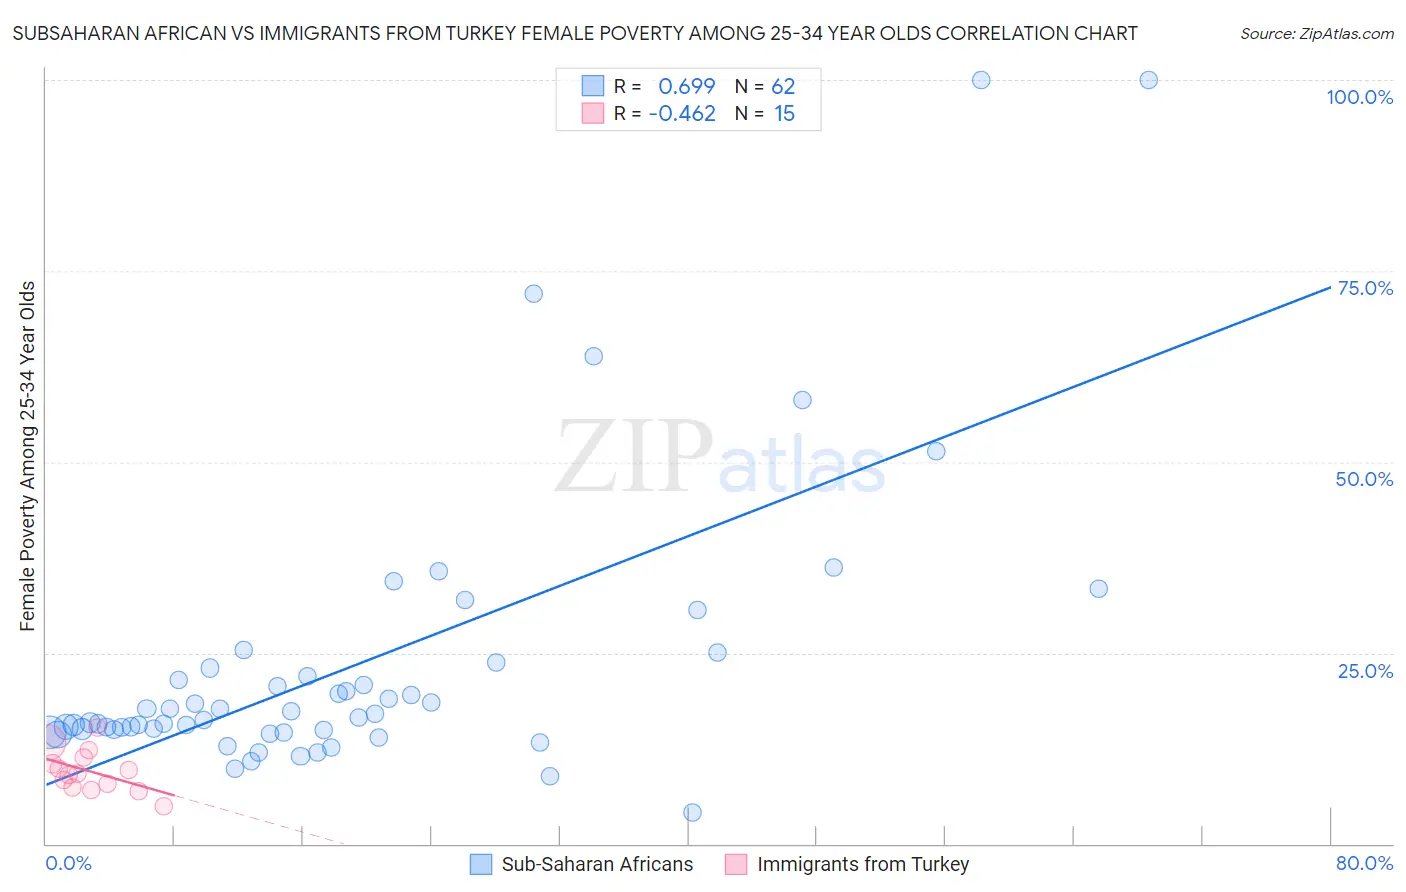
Subsaharan African vs Immigrants from Turkey Female Poverty Among 25-34 Year Olds Correlation Chart
The statistical analysis conducted on geographies consisting of 497,619,538 people shows a significant positive correlation between the proportion of Sub-Saharan Africans and poverty level among females between the ages 25 and 34 in the United States with a correlation coefficient (R) of 0.699 and weighted average of 15.6%. Similarly, the statistical analysis conducted on geographies consisting of 220,548,075 people shows a moderate negative correlation between the proportion of Immigrants from Turkey and poverty level among females between the ages 25 and 34 in the United States with a correlation coefficient (R) of -0.462 and weighted average of 11.9%, a difference of 31.2%.
Female Poverty Among 25-34 Year Olds Correlation Summary
| Measurement | Subsaharan African | Immigrants from Turkey |
| Minimum | 4.1% | 4.9% |
| Maximum | 100.0% | 15.3% |
| Range | 95.9% | 10.3% |
| Mean | 23.5% | 9.5% |
| Median | 16.7% | 9.1% |
| Interquartile 25% (IQ1) | 14.9% | 7.3% |
| Interquartile 75% (IQ3) | 23.0% | 11.3% |
| Interquartile Range (IQR) | 8.1% | 4.0% |
| Standard Deviation (Sample) | 18.9% | 2.7% |
| Standard Deviation (Population) | 18.7% | 2.6% |
Similar Demographics by Female Poverty Among 25-34 Year Olds
Demographics Similar to Sub-Saharan Africans by Female Poverty Among 25-34 Year Olds
In terms of female poverty among 25-34 year olds, the demographic groups most similar to Sub-Saharan Africans are British West Indian (15.6%, a difference of 0.15%), Cree (15.6%, a difference of 0.16%), Immigrants from Senegal (15.6%, a difference of 0.21%), Senegalese (15.6%, a difference of 0.22%), and Nonimmigrants (15.6%, a difference of 0.33%).
| Demographics | Rating | Rank | Female Poverty Among 25-34 Year Olds |
| Immigrants | Belize | 0.2 /100 | #262 | Tragic 15.3% |
| Mexican American Indians | 0.2 /100 | #263 | Tragic 15.4% |
| Pennsylvania Germans | 0.1 /100 | #264 | Tragic 15.4% |
| Immigrants | Liberia | 0.1 /100 | #265 | Tragic 15.4% |
| Immigrants | Somalia | 0.1 /100 | #266 | Tragic 15.4% |
| Central Americans | 0.1 /100 | #267 | Tragic 15.5% |
| Immigrants | Senegal | 0.1 /100 | #268 | Tragic 15.6% |
| Sub-Saharan Africans | 0.1 /100 | #269 | Tragic 15.6% |
| British West Indians | 0.1 /100 | #270 | Tragic 15.6% |
| Cree | 0.1 /100 | #271 | Tragic 15.6% |
| Senegalese | 0.1 /100 | #272 | Tragic 15.6% |
| Immigrants | Nonimmigrants | 0.1 /100 | #273 | Tragic 15.6% |
| Immigrants | Caribbean | 0.0 /100 | #274 | Tragic 15.7% |
| Immigrants | Azores | 0.0 /100 | #275 | Tragic 15.8% |
| Immigrants | Zaire | 0.0 /100 | #276 | Tragic 15.8% |
Demographics Similar to Immigrants from Turkey by Female Poverty Among 25-34 Year Olds
In terms of female poverty among 25-34 year olds, the demographic groups most similar to Immigrants from Turkey are Egyptian (11.9%, a difference of 0.25%), Immigrants from Australia (11.9%, a difference of 0.26%), Immigrants from Indonesia (11.8%, a difference of 0.30%), Immigrants from Bulgaria (11.8%, a difference of 0.42%), and Macedonian (11.9%, a difference of 0.53%).
| Demographics | Rating | Rank | Female Poverty Among 25-34 Year Olds |
| Cambodians | 99.9 /100 | #35 | Exceptional 11.7% |
| Immigrants | Sri Lanka | 99.8 /100 | #36 | Exceptional 11.8% |
| Taiwanese | 99.8 /100 | #37 | Exceptional 11.8% |
| Immigrants | North Macedonia | 99.8 /100 | #38 | Exceptional 11.8% |
| Latvians | 99.8 /100 | #39 | Exceptional 11.8% |
| Immigrants | Bulgaria | 99.8 /100 | #40 | Exceptional 11.8% |
| Immigrants | Indonesia | 99.8 /100 | #41 | Exceptional 11.8% |
| Immigrants | Turkey | 99.7 /100 | #42 | Exceptional 11.9% |
| Egyptians | 99.7 /100 | #43 | Exceptional 11.9% |
| Immigrants | Australia | 99.7 /100 | #44 | Exceptional 11.9% |
| Macedonians | 99.7 /100 | #45 | Exceptional 11.9% |
| Immigrants | Serbia | 99.7 /100 | #46 | Exceptional 11.9% |
| Koreans | 99.6 /100 | #47 | Exceptional 12.0% |
| Immigrants | Belarus | 99.6 /100 | #48 | Exceptional 12.0% |
| Immigrants | Egypt | 99.6 /100 | #49 | Exceptional 12.0% |