Spanish American Indian vs Asian Child Poverty Among Girls Under 16

COMPARE

Spanish American Indian
Race
Ancestry
AfghanAfricanAlaska NativeAlaskan AthabascanAlbanianAleutAlsatianAmericanApacheArabArapahoArgentineanArmenianAssyrian/Chaldean/SyriacAustralianAustrianBahamianBangladeshiBarbadianBasqueBelgianBelizeanBermudanBhutaneseBlackfeetBolivianBrazilianBritishBritish West IndianBulgarianBurmeseCajunCambodianCanadianCape VerdeanCarpatho RusynCelticCentral AmericanCentral American IndianCherokeeCheyenneChickasawChileanChineseChippewaChoctawColombianColvilleComancheCosta RicanCreeCreekCroatianCrowCubanCypriotCzechCzechoslovakianDanishDelawareDominicanDutchDutch West IndianEastern EuropeanEcuadorianEgyptianEnglishEstonianEthiopianEuropeanFijianFilipinoFinnishFrenchFrench American IndianFrench CanadianGermanGerman RussianGhanaianGreekGuamanian/ChamorroGuatemalanGuyaneseHaitianHmongHonduranHopiHoumaHungarianIcelanderIndian (Asian)IndonesianInupiatIranianIraqiIrishIroquoisIsraeliItalianJamaicanJapaneseJordanianKenyanKiowaKoreanLaotianLatvianLebaneseLiberianLithuanianLumbeeLuxembourgerMacedonianMalaysianMalteseMarshalleseMenomineeMexicanMexican American IndianMongolianMoroccanNative HawaiianNavajoNepaleseNew ZealanderNicaraguanNigerianNorthern EuropeanNorwegianOkinawanOsageOttawaPaiutePakistaniPalestinianPanamanianParaguayanPennsylvania GermanPeruvianPimaPolishPortuguesePotawatomiPuebloPuerto RicanPuget Sound SalishRomanianRussianSalvadoranSamoanScandinavianScotch-IrishScottishSeminoleSenegaleseSerbianShoshoneSierra LeoneanSiouxSlavicSlovakSloveneSomaliSouth AfricanSouth AmericanSouth American IndianSoviet UnionSpaniardSpanishSpanish AmericanSpanish American IndianSri LankanSubsaharan AfricanSudaneseSwedishSwissSyrianTaiwaneseThaiTlingit-HaidaTohono O'OdhamTonganTrinidadian and TobagonianTsimshianTurkishU.S. Virgin IslanderUgandanUkrainianUruguayanUteVenezuelanVietnameseWelshWest IndianYakamaYaquiYugoslavianYumanYup'ikZimbabwean
Immigration
NonimmigrantsImmigrantsAfghanistanAfricaAlbaniaArgentinaArmeniaAsiaAustraliaAustriaBahamasBangladeshBarbadosBelarusBelgiumBelizeBoliviaBosnia and HerzegovinaBrazilBulgariaBurma/MyanmarCabo VerdeCambodiaCameroonCanadaCaribbeanCentral AmericaChileChinaColombiaCongoCosta RicaCroatiaCubaCzechoslovakiaDenmarkDominicaDominican RepublicEastern AfricaEastern AsiaEastern EuropeEcuadorEgyptEl SalvadorEnglandEritreaEthiopiaEuropeFijiFranceGermanyGhanaGreeceGrenadaGuatemalaGuyanaHaitiHondurasHong KongHungaryIndiaIndonesiaIranIraqIrelandIsraelItalyJamaicaJapanJordanKazakhstanKenyaKoreaKuwaitLaosLatin AmericaLatviaLebanonLiberiaLithuaniaMalaysiaMexicoMicronesiaMiddle AfricaMoldovaMoroccoNepalNetherlandsNicaraguaNigeriaNorth AmericaNorth MacedoniaNorthern AfricaNorthern EuropeNorwayOceaniaPakistanPanamaPeruPhilippinesPolandPortugalRomaniaRussiaSaudi ArabiaScotlandSenegalSerbiaSierra LeoneSingaporeSomaliaSouth AfricaSouth AmericaSouth Central AsiaSouth Eastern AsiaSouthern EuropeSpainSri LankaSt. Vincent and the GrenadinesSudanSwedenSwitzerlandSyriaTaiwanThailandTrinidad and TobagoTurkeyUgandaUkraineUruguayUzbekistanVenezuelaVietnamWest IndiesWestern AfricaWestern AsiaWestern EuropeYemenZaireZimbabweAzores
Asian
Race
Ancestry
AfghanAfricanAlaska NativeAlaskan AthabascanAlbanianAleutAlsatianAmericanApacheArabArapahoArgentineanArmenianAssyrian/Chaldean/SyriacAustralianAustrianBahamianBangladeshiBarbadianBasqueBelgianBelizeanBermudanBhutaneseBlackfeetBolivianBrazilianBritishBritish West IndianBulgarianBurmeseCajunCambodianCanadianCape VerdeanCarpatho RusynCelticCentral AmericanCentral American IndianCherokeeCheyenneChickasawChileanChineseChippewaChoctawColombianColvilleComancheCosta RicanCreeCreekCroatianCrowCubanCypriotCzechCzechoslovakianDanishDelawareDominicanDutchDutch West IndianEastern EuropeanEcuadorianEgyptianEnglishEstonianEthiopianEuropeanFijianFilipinoFinnishFrenchFrench American IndianFrench CanadianGermanGerman RussianGhanaianGreekGuamanian/ChamorroGuatemalanGuyaneseHaitianHmongHonduranHopiHoumaHungarianIcelanderIndian (Asian)IndonesianInupiatIranianIraqiIrishIroquoisIsraeliItalianJamaicanJapaneseJordanianKenyanKiowaKoreanLaotianLatvianLebaneseLiberianLithuanianLumbeeLuxembourgerMacedonianMalaysianMalteseMarshalleseMenomineeMexicanMexican American IndianMongolianMoroccanNative HawaiianNavajoNepaleseNew ZealanderNicaraguanNigerianNorthern EuropeanNorwegianOkinawanOsageOttawaPaiutePakistaniPalestinianPanamanianParaguayanPennsylvania GermanPeruvianPimaPolishPortuguesePotawatomiPuebloPuerto RicanPuget Sound SalishRomanianRussianSalvadoranSamoanScandinavianScotch-IrishScottishSeminoleSenegaleseSerbianShoshoneSierra LeoneanSiouxSlavicSlovakSloveneSomaliSouth AfricanSouth AmericanSouth American IndianSoviet UnionSpaniardSpanishSpanish AmericanSri LankanSubsaharan AfricanSudaneseSwedishSwissSyrianTaiwaneseThaiTlingit-HaidaTohono O'OdhamTonganTrinidadian and TobagonianTsimshianTurkishU.S. Virgin IslanderUgandanUkrainianUruguayanUteVenezuelanVietnameseWelshWest IndianYakamaYaquiYugoslavianYumanYup'ikZimbabwean
Immigration
NonimmigrantsImmigrantsAfghanistanAfricaAlbaniaArgentinaArmeniaAsiaAustraliaAustriaBahamasBangladeshBarbadosBelarusBelgiumBelizeBoliviaBosnia and HerzegovinaBrazilBulgariaBurma/MyanmarCabo VerdeCambodiaCameroonCanadaCaribbeanCentral AmericaChileChinaColombiaCongoCosta RicaCroatiaCubaCzechoslovakiaDenmarkDominicaDominican RepublicEastern AfricaEastern AsiaEastern EuropeEcuadorEgyptEl SalvadorEnglandEritreaEthiopiaEuropeFijiFranceGermanyGhanaGreeceGrenadaGuatemalaGuyanaHaitiHondurasHong KongHungaryIndiaIndonesiaIranIraqIrelandIsraelItalyJamaicaJapanJordanKazakhstanKenyaKoreaKuwaitLaosLatin AmericaLatviaLebanonLiberiaLithuaniaMalaysiaMexicoMicronesiaMiddle AfricaMoldovaMoroccoNepalNetherlandsNicaraguaNigeriaNorth AmericaNorth MacedoniaNorthern AfricaNorthern EuropeNorwayOceaniaPakistanPanamaPeruPhilippinesPolandPortugalRomaniaRussiaSaudi ArabiaScotlandSenegalSerbiaSierra LeoneSingaporeSomaliaSouth AfricaSouth AmericaSouth Central AsiaSouth Eastern AsiaSouthern EuropeSpainSri LankaSt. Vincent and the GrenadinesSudanSwedenSwitzerlandSyriaTaiwanThailandTrinidad and TobagoTurkeyUgandaUkraineUruguayUzbekistanVenezuelaVietnamWest IndiesWestern AfricaWestern AsiaWestern EuropeYemenZaireZimbabweAzores
Child Poverty Among Girls Under 16
Income
Poverty
Unemployment
Labor Participation
Family Structure
Vehicle Availability
Education Level
Disability

Child Poverty Among Girls Under 16 Comparison

Spanish American Indians

Asians

Tragic
Exceptional
19.9%
CHILD POVERTY AMONG GIRLS UNDER 16
0.1/ 100
METRIC RATING
268th/ 347
METRIC RANK
13.7%
CHILD POVERTY AMONG GIRLS UNDER 16
99.7/ 100
METRIC RATING
30th/ 347
METRIC RANK

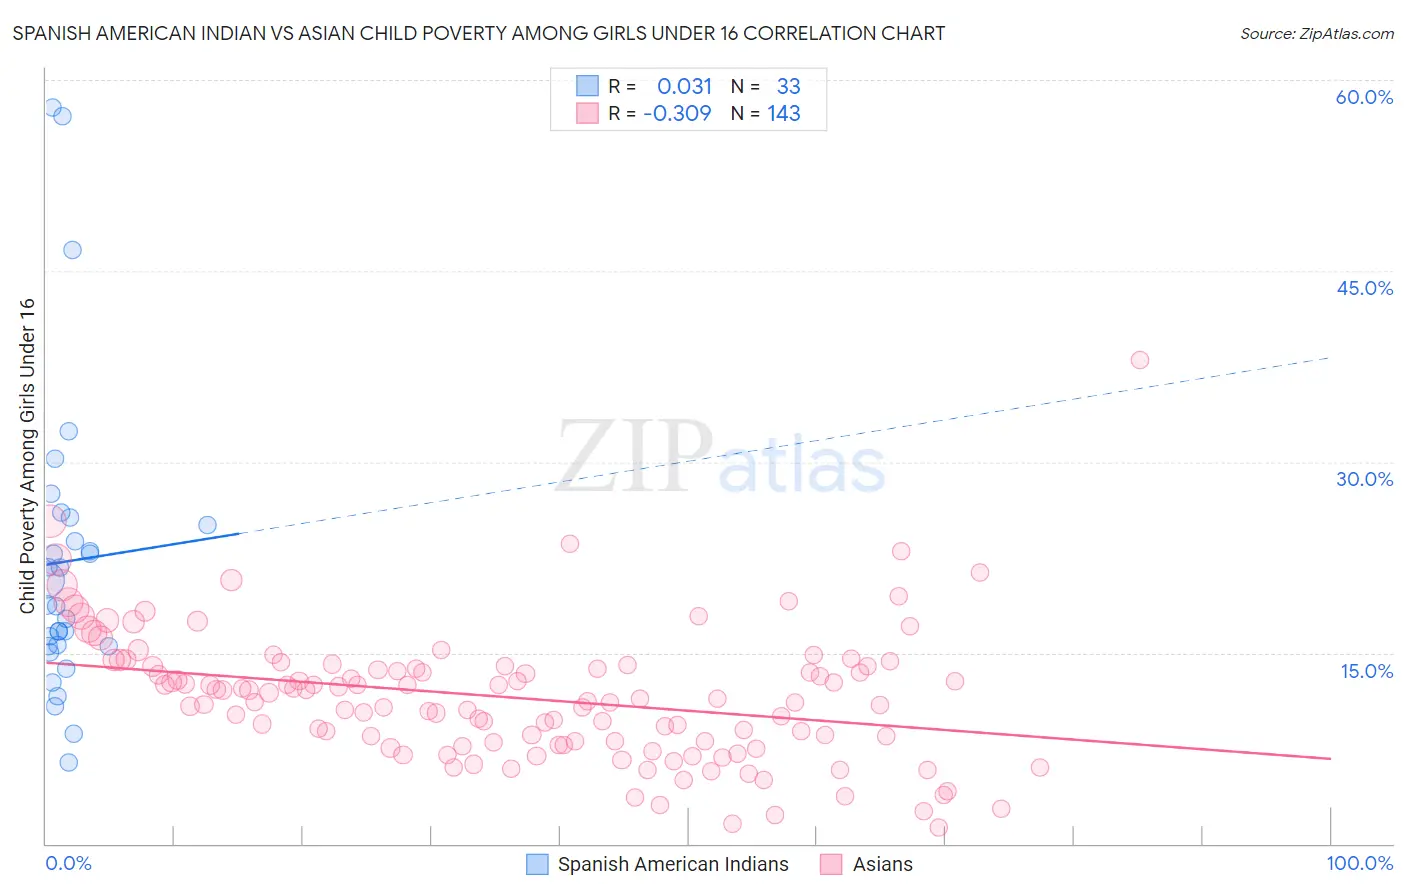
Spanish American Indian vs Asian Child Poverty Among Girls Under 16 Correlation Chart

The statistical analysis conducted on geographies consisting of 72,992,816 people shows no correlation between the proportion of Spanish American Indians and poverty level among girls under the age of 16 in the United States with a correlation coefficient (R) of 0.031 and weighted average of 19.9%. Similarly, the statistical analysis conducted on geographies consisting of 532,137,785 people shows a mild negative correlation between the proportion of Asians and poverty level among girls under the age of 16 in the United States with a correlation coefficient (R) of -0.309 and weighted average of 13.7%, a difference of 45.3%.
Spanish American Indian vs Asian Child Poverty Among Girls Under 16

Child Poverty Among Girls Under 16 Correlation Summary

MeasurementSpanish American IndianAsian
Minimum6.4%1.3%
Maximum57.8%38.0%
Range51.4%36.7%
Mean22.2%11.5%
Median18.8%11.4%
Interquartile 25% (IQ1)15.5%8.0%
Interquartile 75% (IQ3)25.3%13.9%
Interquartile Range (IQR)9.8%5.9%
Standard Deviation (Sample)11.9%5.2%
Standard Deviation (Population)11.7%5.2%

Similar Demographics by Child Poverty Among Girls Under 16

Demographics Similar to Spanish American Indians by Child Poverty Among Girls Under 16

In terms of child poverty among girls under 16, the demographic groups most similar to Spanish American Indians are Immigrants from Bangladesh (19.9%, a difference of 0.040%), Liberian (19.9%, a difference of 0.10%), Spanish American (19.8%, a difference of 0.26%), Cherokee (19.9%, a difference of 0.28%), and Immigrants from Barbados (19.9%, a difference of 0.38%).
DemographicsRating | RankChild Poverty Among Girls Under 16
Vietnamese
0.2
/100
|
#261
Tragic
19.5%
Chickasaw
0.1
/100
|
#262
Tragic
19.6%
Immigrants | Burma/Myanmar
0.1
/100
|
#263
Tragic
19.7%
Jamaicans
0.1
/100
|
#264
Tragic
19.7%
Immigrants | Jamaica
0.1
/100
|
#265
Tragic
19.8%
Spanish Americans
0.1
/100
|
#266
Tragic
19.8%
Immigrants | Bangladesh
0.1
/100
|
#267
Tragic
19.9%
Spanish American Indians
0.1
/100
|
#268
Tragic
19.9%
Liberians
0.1
/100
|
#269
Tragic
19.9%
Cherokee
0.1
/100
|
#270
Tragic
19.9%
Immigrants | Barbados
0.1
/100
|
#271
Tragic
19.9%
Immigrants | El Salvador
0.1
/100
|
#272
Tragic
20.0%
Bangladeshis
0.1
/100
|
#273
Tragic
20.0%
Immigrants | St. Vincent and the Grenadines
0.0
/100
|
#274
Tragic
20.1%
Sub-Saharan Africans
0.0
/100
|
#275
Tragic
20.1%

Demographics Similar to Asians by Child Poverty Among Girls Under 16

In terms of child poverty among girls under 16, the demographic groups most similar to Asians are Turkish (13.7%, a difference of 0.12%), Danish (13.7%, a difference of 0.16%), Swedish (13.7%, a difference of 0.19%), Maltese (13.7%, a difference of 0.24%), and Bolivian (13.6%, a difference of 0.67%).
DemographicsRating | RankChild Poverty Among Girls Under 16
Norwegians
99.9
/100
|
#23
Exceptional
13.3%
Immigrants | Eastern Asia
99.9
/100
|
#24
Exceptional
13.4%
Immigrants | China
99.8
/100
|
#25
Exceptional
13.4%
Eastern Europeans
99.8
/100
|
#26
Exceptional
13.5%
Latvians
99.8
/100
|
#27
Exceptional
13.5%
Tongans
99.8
/100
|
#28
Exceptional
13.6%
Bolivians
99.8
/100
|
#29
Exceptional
13.6%
Asians
99.7
/100
|
#30
Exceptional
13.7%
Turks
99.7
/100
|
#31
Exceptional
13.7%
Danes
99.7
/100
|
#32
Exceptional
13.7%
Swedes
99.7
/100
|
#33
Exceptional
13.7%
Maltese
99.7
/100
|
#34
Exceptional
13.7%
Immigrants | Northern Europe
99.6
/100
|
#35
Exceptional
13.8%
Russians
99.6
/100
|
#36
Exceptional
13.9%
Lithuanians
99.6
/100
|
#37
Exceptional
13.9%