Slavic vs Immigrants from Japan Poverty
COMPARE
Slavic
Immigrants from Japan
Poverty
Poverty Comparison
Slavs
Immigrants from Japan
11.5%
POVERTY
93.3/ 100
METRIC RATING
101st/ 347
METRIC RANK
11.0%
POVERTY
98.9/ 100
METRIC RATING
49th/ 347
METRIC RANK
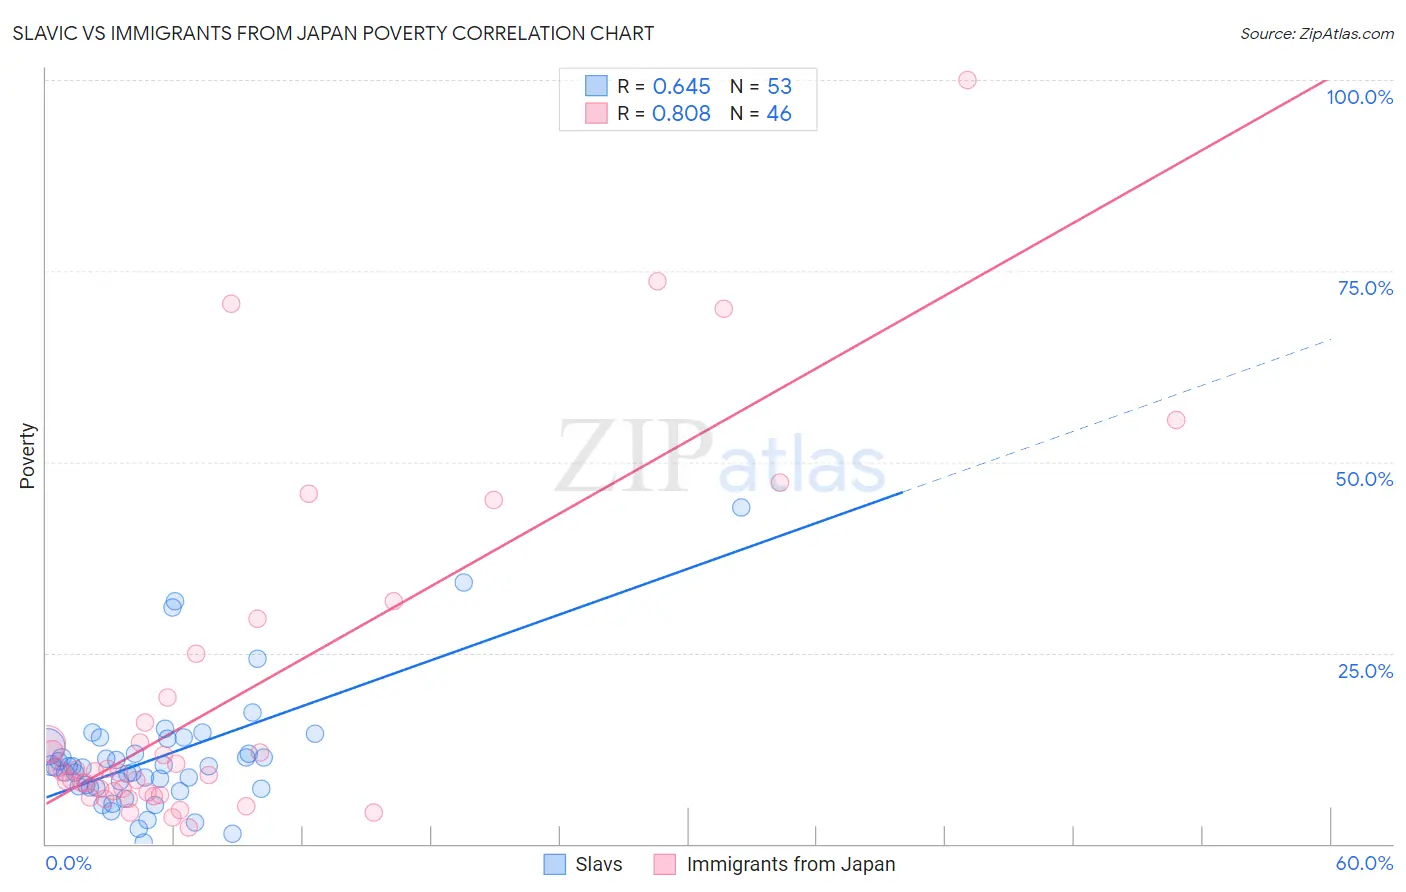
Slavic vs Immigrants from Japan Poverty Correlation Chart
The statistical analysis conducted on geographies consisting of 270,786,783 people shows a significant positive correlation between the proportion of Slavs and poverty level in the United States with a correlation coefficient (R) of 0.645 and weighted average of 11.5%. Similarly, the statistical analysis conducted on geographies consisting of 340,013,080 people shows a very strong positive correlation between the proportion of Immigrants from Japan and poverty level in the United States with a correlation coefficient (R) of 0.808 and weighted average of 11.0%, a difference of 5.0%.
Poverty Correlation Summary
| Measurement | Slavic | Immigrants from Japan |
| Minimum | 0.14% | 2.0% |
| Maximum | 44.1% | 100.0% |
| Range | 43.9% | 98.0% |
| Mean | 11.4% | 19.4% |
| Median | 10.1% | 9.4% |
| Interquartile 25% (IQ1) | 7.4% | 6.6% |
| Interquartile 75% (IQ3) | 13.2% | 19.2% |
| Interquartile Range (IQR) | 5.8% | 12.6% |
| Standard Deviation (Sample) | 8.2% | 22.6% |
| Standard Deviation (Population) | 8.1% | 22.4% |
Similar Demographics by Poverty
Demographics Similar to Slavs by Poverty
In terms of poverty, the demographic groups most similar to Slavs are Scottish (11.5%, a difference of 0.31%), Laotian (11.6%, a difference of 0.34%), Okinawan (11.6%, a difference of 0.34%), Immigrants from Indonesia (11.5%, a difference of 0.42%), and Native Hawaiian (11.6%, a difference of 0.45%).
| Demographics | Rating | Rank | Poverty |
| Paraguayans | 94.9 /100 | #94 | Exceptional 11.4% |
| Australians | 94.9 /100 | #95 | Exceptional 11.4% |
| Immigrants | South Africa | 94.7 /100 | #96 | Exceptional 11.5% |
| Immigrants | Egypt | 94.6 /100 | #97 | Exceptional 11.5% |
| Immigrants | Latvia | 94.5 /100 | #98 | Exceptional 11.5% |
| Immigrants | Indonesia | 94.2 /100 | #99 | Exceptional 11.5% |
| Scottish | 94.0 /100 | #100 | Exceptional 11.5% |
| Slavs | 93.3 /100 | #101 | Exceptional 11.5% |
| Laotians | 92.4 /100 | #102 | Exceptional 11.6% |
| Okinawans | 92.4 /100 | #103 | Exceptional 11.6% |
| Native Hawaiians | 92.1 /100 | #104 | Exceptional 11.6% |
| Portuguese | 92.1 /100 | #105 | Exceptional 11.6% |
| Immigrants | Zimbabwe | 92.1 /100 | #106 | Exceptional 11.6% |
| Palestinians | 91.8 /100 | #107 | Exceptional 11.6% |
| Canadians | 91.7 /100 | #108 | Exceptional 11.6% |
Demographics Similar to Immigrants from Japan by Poverty
In terms of poverty, the demographic groups most similar to Immigrants from Japan are Slovene (11.0%, a difference of 0.010%), Asian (11.0%, a difference of 0.030%), Immigrants from Romania (11.0%, a difference of 0.050%), Immigrants from Czechoslovakia (11.0%, a difference of 0.070%), and Turkish (11.0%, a difference of 0.15%).
| Demographics | Rating | Rank | Poverty |
| Koreans | 99.2 /100 | #42 | Exceptional 10.9% |
| Immigrants | Singapore | 99.2 /100 | #43 | Exceptional 10.9% |
| Immigrants | Moldova | 99.1 /100 | #44 | Exceptional 10.9% |
| Turks | 98.9 /100 | #45 | Exceptional 11.0% |
| Immigrants | Czechoslovakia | 98.9 /100 | #46 | Exceptional 11.0% |
| Immigrants | Romania | 98.9 /100 | #47 | Exceptional 11.0% |
| Slovenes | 98.9 /100 | #48 | Exceptional 11.0% |
| Immigrants | Japan | 98.9 /100 | #49 | Exceptional 11.0% |
| Asians | 98.9 /100 | #50 | Exceptional 11.0% |
| Immigrants | Croatia | 98.7 /100 | #51 | Exceptional 11.0% |
| Immigrants | Philippines | 98.7 /100 | #52 | Exceptional 11.0% |
| Immigrants | Austria | 98.6 /100 | #53 | Exceptional 11.1% |
| Immigrants | Bulgaria | 98.5 /100 | #54 | Exceptional 11.1% |
| Immigrants | Serbia | 98.5 /100 | #55 | Exceptional 11.1% |
| Estonians | 98.2 /100 | #56 | Exceptional 11.1% |