Brazilian vs Immigrants from Japan Poverty
COMPARE
Brazilian
Immigrants from Japan
Poverty
Poverty Comparison
Brazilians
Immigrants from Japan
11.9%
POVERTY
79.7/ 100
METRIC RATING
143rd/ 347
METRIC RANK
11.0%
POVERTY
98.9/ 100
METRIC RATING
49th/ 347
METRIC RANK
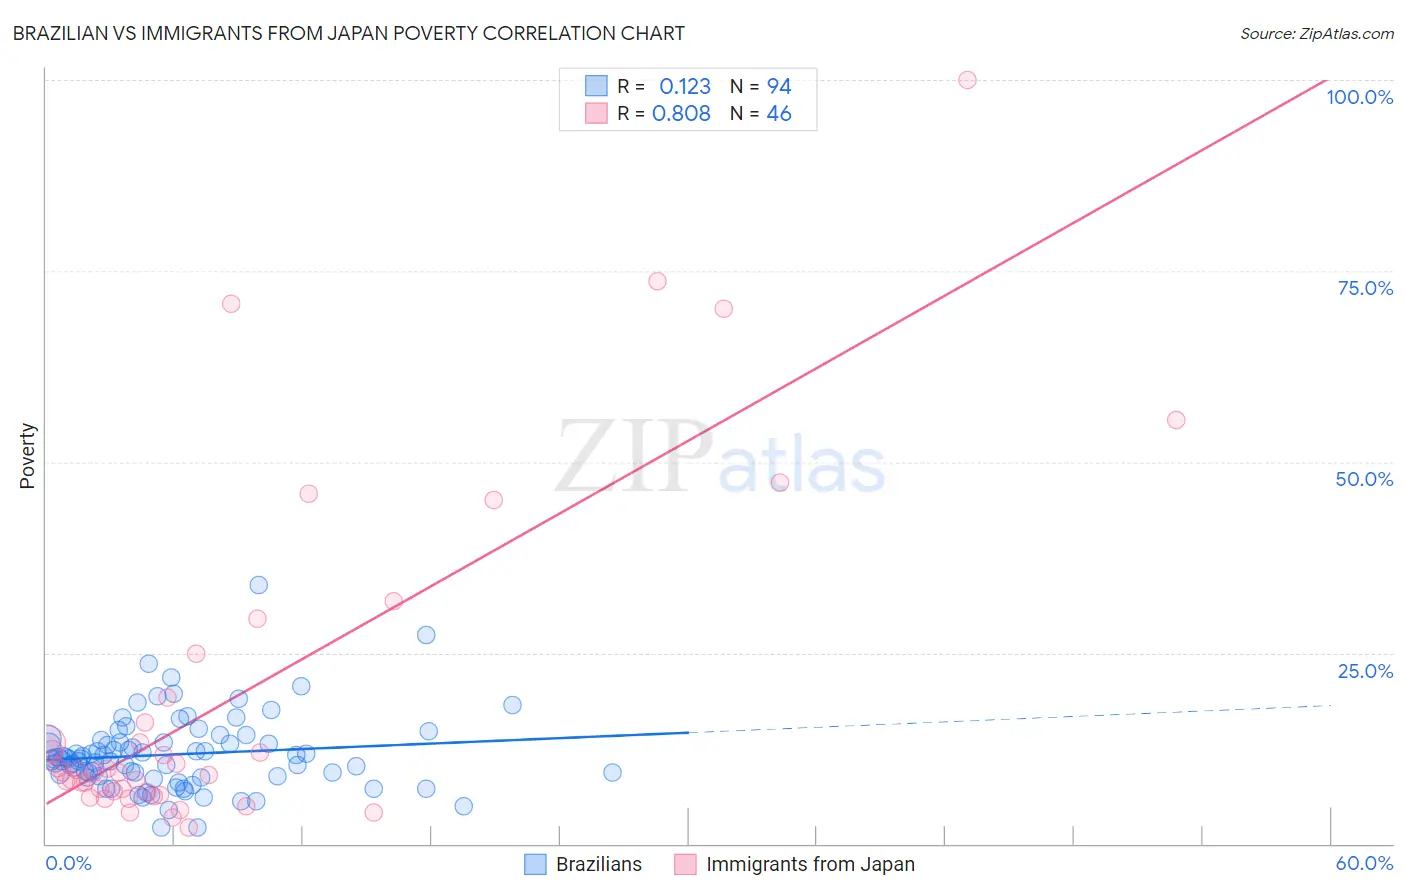
Brazilian vs Immigrants from Japan Poverty Correlation Chart
The statistical analysis conducted on geographies consisting of 323,736,461 people shows a poor positive correlation between the proportion of Brazilians and poverty level in the United States with a correlation coefficient (R) of 0.123 and weighted average of 11.9%. Similarly, the statistical analysis conducted on geographies consisting of 340,013,080 people shows a very strong positive correlation between the proportion of Immigrants from Japan and poverty level in the United States with a correlation coefficient (R) of 0.808 and weighted average of 11.0%, a difference of 8.5%.
Poverty Correlation Summary
| Measurement | Brazilian | Immigrants from Japan |
| Minimum | 2.1% | 2.0% |
| Maximum | 33.9% | 100.0% |
| Range | 31.8% | 98.0% |
| Mean | 11.7% | 19.4% |
| Median | 11.1% | 9.4% |
| Interquartile 25% (IQ1) | 8.8% | 6.6% |
| Interquartile 75% (IQ3) | 13.3% | 19.2% |
| Interquartile Range (IQR) | 4.5% | 12.6% |
| Standard Deviation (Sample) | 5.0% | 22.6% |
| Standard Deviation (Population) | 5.0% | 22.4% |
Similar Demographics by Poverty
Demographics Similar to Brazilians by Poverty
In terms of poverty, the demographic groups most similar to Brazilians are Basque (11.9%, a difference of 0.11%), Immigrants from France (11.9%, a difference of 0.12%), Immigrants from Peru (11.9%, a difference of 0.22%), Icelander (11.9%, a difference of 0.27%), and Pakistani (11.9%, a difference of 0.41%).
| Demographics | Rating | Rank | Poverty |
| Chileans | 84.2 /100 | #136 | Excellent 11.8% |
| Immigrants | Switzerland | 83.0 /100 | #137 | Excellent 11.8% |
| Immigrants | Jordan | 82.4 /100 | #138 | Excellent 11.9% |
| Pakistanis | 82.2 /100 | #139 | Excellent 11.9% |
| Immigrants | Peru | 81.1 /100 | #140 | Excellent 11.9% |
| Immigrants | France | 80.5 /100 | #141 | Excellent 11.9% |
| Basques | 80.4 /100 | #142 | Excellent 11.9% |
| Brazilians | 79.7 /100 | #143 | Good 11.9% |
| Icelanders | 77.9 /100 | #144 | Good 11.9% |
| Syrians | 75.1 /100 | #145 | Good 12.0% |
| Afghans | 74.9 /100 | #146 | Good 12.0% |
| Immigrants | Bosnia and Herzegovina | 73.7 /100 | #147 | Good 12.0% |
| Immigrants | Germany | 72.7 /100 | #148 | Good 12.0% |
| Immigrants | Malaysia | 72.7 /100 | #149 | Good 12.0% |
| Immigrants | Kazakhstan | 72.3 /100 | #150 | Good 12.0% |
Demographics Similar to Immigrants from Japan by Poverty
In terms of poverty, the demographic groups most similar to Immigrants from Japan are Slovene (11.0%, a difference of 0.010%), Asian (11.0%, a difference of 0.030%), Immigrants from Romania (11.0%, a difference of 0.050%), Immigrants from Czechoslovakia (11.0%, a difference of 0.070%), and Turkish (11.0%, a difference of 0.15%).
| Demographics | Rating | Rank | Poverty |
| Koreans | 99.2 /100 | #42 | Exceptional 10.9% |
| Immigrants | Singapore | 99.2 /100 | #43 | Exceptional 10.9% |
| Immigrants | Moldova | 99.1 /100 | #44 | Exceptional 10.9% |
| Turks | 98.9 /100 | #45 | Exceptional 11.0% |
| Immigrants | Czechoslovakia | 98.9 /100 | #46 | Exceptional 11.0% |
| Immigrants | Romania | 98.9 /100 | #47 | Exceptional 11.0% |
| Slovenes | 98.9 /100 | #48 | Exceptional 11.0% |
| Immigrants | Japan | 98.9 /100 | #49 | Exceptional 11.0% |
| Asians | 98.9 /100 | #50 | Exceptional 11.0% |
| Immigrants | Croatia | 98.7 /100 | #51 | Exceptional 11.0% |
| Immigrants | Philippines | 98.7 /100 | #52 | Exceptional 11.0% |
| Immigrants | Austria | 98.6 /100 | #53 | Exceptional 11.1% |
| Immigrants | Bulgaria | 98.5 /100 | #54 | Exceptional 11.1% |
| Immigrants | Serbia | 98.5 /100 | #55 | Exceptional 11.1% |
| Estonians | 98.2 /100 | #56 | Exceptional 11.1% |